PostHog ARR jumped 459% in one year while Amplitude grew just 17%
ARR Growth ($M): Developer-Centric vs. Traditional Analytics
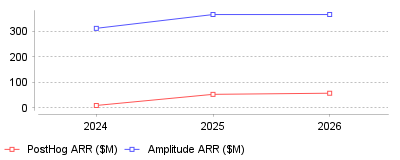
| Year | PostHog ARR ($M) | Amplitude ARR ($M) |
|---|
| 2024 | 9.5 | 312 |
| 2025 | 53.1 | 366 |
| 2026 | 57.5 | 366 |
The Shift Towards Developer-Centric, All-In-One Product Analytics
What is this showing
This data illustrates the divergent growth trajectories between legacy product analytics platforms and modern, developer-centric infrastructures. While Amplitude—a long-standing enterprise leader—maintains a steady Annual Recurring Revenue (ARR) growth of approximately 17% year-over-year [source], PostHog is experiencing exponential momentum, scaling its ARR by nearly 99% year-over-year in early 2026 [source]. Concurrently, the broader global product analytics market is expanding aggressively, projected to grow from $14.78 billion in 2025 to over $41 billion by 2030 [source].
What this means
At a micro level, this trend signifies a structural transfer of purchasing power and operational influence from traditional product managers to product engineers. Technical teams are increasingly rejecting fragmented tech stacks where they must stitch together disparate tools for event tracking, experimentation, and bug monitoring [source]. Instead, they are favoring usage-based, self-serve models over opaque, seat-based enterprise contracts that throttle broad team adoption [source]. At a macro industry level, vendors are being forced to evolve far beyond standard behavioral dashboards. To remain competitive in an expanding market, analytics companies must incorporate highly technical capabilities like LLM observability, agentic AI querying, and native data warehousing to provide actionable value [source].
Why is this important
The shift towards consolidated analytics is critically important because it directly addresses the software industry's escalating data complexity crisis. With the average B2B SaaS company relying on over 100 different software tools, data silos have become a massive financial burden, consuming up to 30% of analytics budgets simply for data preparation [source]. An all-in-one platform reduces these integration bottlenecks, allowing teams to securely connect user behavior with technical performance and feature rollouts in real time [source]. Ultimately, bridging the gap between product performance and engineering execution enables companies to iterate faster, lower their operational expenditures, and deliver superior user experiences.
What might have caused this
This industry transformation was likely catalyzed by the widespread adoption of product-led growth (PLG) strategies, which grew to encompass 60% of all SaaS companies by 2024 [source]. In a PLG environment, the software itself drives user acquisition and retention, meaning the engineers actively building the product require immediate, granular insights into how their code impacts user behavior. Concurrently, the rapid explosion of generative AI applications created a sudden vacuum for tools capable of tracking LLM prompt success, error rates, and console logs—features that legacy analytics platforms initially lacked natively [source]. Finally, tightening macroeconomic conditions likely pushed startups and mid-market organizations to seek highly transparent, open-source alternatives that consolidate their tech stack and eliminate expensive vendor lock-in [source].
Conclusion
The product analytics category is fundamentally evolving from passive reporting tools designed for marketers into active, consolidated infrastructures built specifically for engineers. As modern development workflows demand real-time integration of feature flagging, session replay, and AI observability, platforms that offer full technical control and transparent pricing will continue to aggressively capture market share. The most prominent takeaway for software companies is that product analytics must no longer be treated as an isolated business function, but rather embedded directly into the core engineering stack to sustain competitive velocity.
The Transformation of Product Analytics Platforms
Global software spending will reach $1.23 trillion in 2025. A 14% annual increase drives this projected software budget
[1]. Capital allocators demand specific return metrics for every software procurement. Broad visibility tools no longer satisfy finance departments. Connecting user behavior to revenue generation operates as a strict requirement for enterprise buyers.
Within the
business intelligence and analytics software market, operators restrict budgets to specialized applications. The category covering
product analytics and usage intelligence platforms generated $14.81 billion in 2023 revenue
[2]. Grand View Research projects this sector will expand at a 19.8% compound annual growth rate through 2030
[2].
Severe vendor consolidation shapes this financial expansion. Chief Information Officers face intense pressure to reduce duplicate contracts. To survive, independent software vendors merge disparate product lines into unified suites. Standalone event tracking rarely secures enterprise budget approvals without corresponding qualitative data.
Usage intelligence platforms sit at the center of this transition. Organizations use these platforms to dictate product roadmaps and evaluate feature success. Modern tools ingest event streams from web applications, mobile devices, and server endpoints. Telemetry collection forms the foundation of modern digital product development.
Market Sizing and Vertical Expansion
Retail operations dominate current adoption metrics. The retail and e-commerce product analytics segment generated $5.14 billion in 2024
[3]. Merchants track digital shopping journeys from initial site visits to final checkout confirmations. By mapping behavioral funnels, they identify exact drop-off points. Analysts expect this retail segment to hit $14.85 billion by 2030
[3].
Media companies represent another distinct growth vector. The media and entertainment analytics segment reached $2.55 billion in 2024
[4]. Content distributors measure video completion rates and subscription conversion paths. These entertainment brands will push the segment to a 22.3% compound annual growth rate through the end of the decade
[4].
North American enterprises accounted for 38.2% of global product analytics revenue in 2024
[5]. Organizations across the United States generated $7.6 billion during this period
[5]. Following this regional dominance, Asia Pacific countries will exhibit the fastest adoption rates over the next five years
[5].
Amplitude validates these macro projections through its direct earnings reports. The vendor reached $366 million in annual recurring revenue for fiscal year 2025
[6]. A 15% revenue increase compared to the prior twelve months highlights strong market demand
[6]. Operating margins improved as the company managed infrastructure costs tightly.
Enterprise momentum drives Amplitude's balance sheet heavily. The company reported 698 accounts paying over $100,000 annually by the end of 2025
[6]. Customers generating more than $1 million in annual recurring revenue rose 33% year-over-year to 56 accounts
[6]. Relying on large contracts shields the firm from high churn rates in the small business sector.
The Developer-First Procurement Shift
PostHog hit $57.5 million in annual recurring revenue by February 2026
[7]. The startup maintained a 99% year-over-year growth rate while servicing 176,000 companies
[8]. This trajectory highlights a major change in software purchasing power. Engineering departments now outspend traditional marketing groups on analytics infrastructure.
Traditional platforms catered exclusively to marketing departments. Newer alternatives target software engineers directly. Technical teams dictate tool selection by prioritizing rapid implementation over visual dashboards. Engineers
tracking specific feature adoption prefer open-source architectures. They embed event capture snippets without waiting for executive procurement approval.
Usage-based pricing accelerates this bottom-up adoption model. PostHog generated between $40,000 and $95,000 in annual recurring revenue per employee at the end of 2024
[9]. The median customer triples its spend within 18 months of initial deployment
[9]. Product engineers install the free version to monitor a single application before expanding usage across the organization.
Venture capitalists reward this structural shift enthusiastically. Peak XV Partners led a $75 million Series E funding round for PostHog in October 2025
[10]. The transaction valued the private company at $1.4 billion
[10]. Capital influx allows developer-native platforms to build competing marketing features.
Incumbent vendors recognize the threat to their market share. Pendo expanded its product cloud platform across Europe in February 2024 to defend its enterprise install base
[11]. Competition forces established players to match the product velocity of developer-native alternatives. Legacy companies must modernize their integration pipelines to survive.
Data Warehousing Compute Expenses
Software licensing fees frequently trail underlying compute costs. Operating an analytics stack requires continuous server processing. Engineers struggle to contain query expenses when data volume scales unpredictably. Organizations face massive monthly bills from cloud providers just to answer basic behavioral questions.
Google BigQuery charges $5 per terabyte of processed data
[12]. Running analytical queries on BigQuery can cost ten times more than executing identical requests on ephemeral Apache Spark clusters
[13]. Analysts deploying
tools designed for growth teams must navigate these infrastructure limitations carefully. Duplicating user data across multiple cloud environments inflates IT budgets. Companies waste thousands of dollars storing identical event logs in separate applications.
Vendors solve this friction through native warehouse connectors. Mixpanel established a direct integration with Google Cloud in 2023
[14]. The partnership allows customers to synchronize BigQuery records into the analytics interface without writing custom pipelines
[15]. Teams query the data directly where it lives.
Organizations abandon siloed event collection entirely. They centralize raw user data inside Snowflake or Databricks. Analytics platforms increasingly operate as visualization layers directly querying these central repositories. This unbundled architecture separates storage costs from interface software licenses.
Proper tagging mechanisms prevent severe cost overruns. Data engineering teams allocate compute expenses by department to identify inefficient queries
[16]. Strict retirement schedules eliminate outdated reports that consume background server resources
[16]. Managing the compute layer requires dedicated personnel monitoring cloud consumption daily.
Category Convergence and Corporate Acquisitions
Contentsquare acquired Heap in September 2023
[17]. The transaction merged digital experience monitoring with quantitative usage metrics. Heap had raised $110 million at a $960 million valuation prior to the acquisition
[18]. The combined entity targets a $70 billion total addressable market by offering a unified interface for session replays and event tracking
[17].
Product teams historically purchased disconnected applications. They used one vendor for quantitative funnel analysis. They bought a separate tool for qualitative screen recordings. Switching between interfaces degraded analytical speed. Engineers spent hours correlating a drop in conversion rates with specific UI rendering errors.
Platforms
visualizing user clicks now ingest macro conversion data natively. This convergence eliminates redundant software contracts. Contentsquare serves 1.3 million websites globally, giving the company massive scale to distribute combined product features
[19]. Expanding the feature set justifies annual price increases for enterprise accounts.
Gartner projects 70% of product managers will manage customer experience goals using analytics software by 2028
[17]. This represents a massive increase from the 19% adoption rate recorded in 2023
[17]. Buyers demand software that handles both macro trends and individual user sessions. Single-feature vendors lose competitive bids to bundled platforms.
Consolidation impacts independent vendors directly. Point solutions face intense pressure to expand functionality or secure acquisition offers. Mid-market companies demand all-in-one software suites to simplify internal deployment requirements. Startups launching isolated tracking tools struggle to secure initial venture funding.
Privacy Regulations and Compliance Penalties
California regulators fined Sephora $1.2 million in 2022 for violating consumer privacy rules
[20]. The cosmetics retailer failed to honor opt-out requests transmitted via the Global Privacy Control protocol
[21]. Authorities use this enforcement action to warn the broader technology sector about careless data practices.
Sephora allowed third-party analytics providers to create customer profiles without offering a clear opt-out mechanism
[22]. Regulators mandated the company alter its service agreements and file subsequent compliance reports
[20]. Ignorance of tracking configurations does not protect corporations from state penalties. Data governance now sits at the board level.
European data protection authorities issued 4.2 billion euros in fines through 2024
[23]. Strict enforcement dictates how modern analytics vendors handle default data collection. European markets require active consent before loading tracking scripts into user browsers.
The General Data Protection Regulation requires explicit consent before tracking begins. Academic research indicates this consent mandate actively alters product innovation. Sales from radical innovations fell 0.9 percentage points among German firms adjusting to GDPR compliance frameworks
[24]. Engineers spend development cycles on consent banners rather than feature releases.
Firms
running native experiments encounter severe blind spots when visitors decline cookie installations. Anonymous users skew conversion metrics. Statistical significance drops when half the website traffic operates invisibly. Teams cannot evaluate split tests accurately without complete user identification.
Companies adopt server-side tracking to mitigate client-side browser restrictions. Analytics software must anonymize IP addresses instantly to avoid violating the California Consumer Privacy Act
[25]. Legal compliance takes precedence over granular event visibility. Organizations sacrifice exact tracking accuracy to avoid devastating regulatory fines.
Artificial Intelligence and Agentic Automation
Amplitude integrated agentic artificial intelligence into its core platform functionality. These autonomous query agents achieved a 76% success rate on complex production requests over a six-month period
[6]. Executives claim this success rate performs seven times better than basic text-to-SQL approaches
[6].
Natural language prompts replace manual query construction. Non-technical employees access behavioral insights without requesting engineering assistance. Marketing managers simply type questions about user churn directly into the search bar. This interface design democratizes data access across the entire corporate structure.
Quantum Metric recorded a 400% increase in usage for its AI summarization tool during the first half of 2025
[26]. Language models analyze thousands of user session recordings to generate immediate written summaries. This automation eliminates the manual labor of watching hours of individual user clicks.
Software vendors absorb massive computing overhead to provide these predictive features. Gartner projects global spending on AI-optimized servers will reach $202 billion by 2025
[17]. Platform providers must price their AI add-ons carefully to protect gross margins. Delivering generative text incurs high processing costs per query.
Machine learning models detect behavioral anomalies automatically. They alert product managers to sudden drop-offs in conversion funnels. The software isolates the root cause by cross-referencing recent code deployments with specific user error logs. Proactive alerting replaces passive dashboard monitoring entirely.
Forrester named Amplitude the only Leader in its Feature Management and Experimentation Wave for Q3 2024
[27]. Connecting AI-driven analytics directly to feature flag releases creates a closed-loop deployment cycle. Code changes revert automatically if the analytics system detects increased crash rates.
The Shift in B2B SaaS Operations
Salesforce added predictive scoring to Sales Cloud in Q3 2024. Analytics platforms must integrate directly with these customer relationship systems. Account-level reporting replaces individual user tracking in enterprise environments. Business software buyers evaluate group behavior rather than isolated clicks.
Product-led growth motions depend entirely on usage intelligence. Sales representatives monitor specific event triggers to identify expansion opportunities. A sudden spike in exported reports signals readiness for an enterprise tier upgrade. Without product telemetry, revenue teams operate blindly during renewal discussions.
Operators deploying
tools designed for SaaS teams map entire account hierarchies. They aggregate individual employee actions into a single corporate health score. This operational alignment connects product metrics directly to net revenue retention. Finance departments use these behavioral scores to forecast quarterly earnings.
Customer success managers rely on product analytics to prevent churn. Declining login frequency triggers automated outreach sequences. The analytics platform orchestrates communication across external marketing tools. Intervention happens before the client requests account cancellation.
Business software requires complex permission structures. Analytics engines must respect role-based access controls when calculating feature usage. An administrator dashboard generates different behavioral data than a standard user profile. Platforms that fail to parse these organizational hierarchies lose enterprise procurement bids.
Operational Outlook and Future Deployment
Chief Information Officers refuse to expand IT budgets without guaranteed efficiency gains. Software spending growth will slow down slightly due to macroeconomic uncertainty
[28]. Cautious optimism forces vendors to demonstrate immediate return on investment. Tools that merely display charts will face rapid decommission.
Sixty-one percent of enterprise leaders felt they began 2025 in a stronger position than the previous year
[28]. However, only 24% expect to beat their annual financial plans
[28]. Budgets remain tight despite stabilizing inflation rates. Procurement teams will audit analytics software utilization strictly.
Product analytics software must prove it reduces customer churn. Platforms tracking usage metrics will absorb adjacent categories. Application performance monitoring and digital experience tools merge into unified interfaces. Vendors must support every digital touchpoint to justify six-figure contract renewals.
Warehouse-native architecture will dominate enterprise deployments over the next three years. Organizations refuse to pay SaaS vendors for redundant cloud storage. Vendors succeeding in 2026 will execute queries directly against customer-owned Databricks environments. This architectural shift fundamentally alters vendor profit margins.
Strict privacy regulations permanently limit client-side tracking. First-party data strategies replace third-party cookies. Identity resolution requires sophisticated probabilistic modeling to track users across multiple devices. The era of unchecked data collection has ended, forcing analytics vendors to deliver precise insights using aggregated, anonymous behavior.