
Product Analytics & Usage Intelligence Platforms
These are the specialized categories within Product Analytics & Usage Intelligence Platforms. Looking for something broader? See all Business Intelligence & Analytics Software categories.

How big is your team?
What's your budget situation?
What's your team's technical comfort level?
What's the ONE thing this tool must do well?

Mixpanel is an advanced product analytics software that is ideal for growth teams in any industry. It provides insightful data on product and user growth, helping businesses to make informed decisions. It supports businesses at every stage, answering foundational questions and aiding sophisticated analysis.
Best for Product Analytics Tools for Growth Teams
Expert Take
Mixpanel is recognized for its advanced product analytics capabilities, offering comprehensive insights into user behavior and product usage. It is widely used by growth teams for its ability to facilitate data-driven decision-making. The platform's robust features and integration capabilities make it a strong contender in the product analytics space.
Pros
- Generous free plan (1M events/month)
- Integrated Session Replay capabilities
- SOC 2 Type II & HIPAA compliant
- Fast, intuitive self-serve reports
Cons
- Expensive scaling with event volume
- Steep learning curve for setup
- HIPAA limited to Enterprise plan
- Support limited on lower tiers
Best for teams that are
- Product and growth teams needing granular, real-time event-based analysis
- Teams focused on converting specific user segments through deep behavioral funnels
Skip if
- Teams preferring automatic data capture over manual instrumentation
- Early-stage startups with very limited budgets, as costs scale with user volume
Best for teams that are
- Product and growth teams needing granular, real-time event-based analysis
- Teams focused on converting specific user segments through deep behavioral funnels
Skip if
- Teams preferring automatic data capture over manual instrumentation
- Early-stage startups with very limited budgets, as costs scale with user volume
Pros
- Generous free plan (1M events/month)
- Native Warehouse Connectors (Snowflake/BigQuery)
- Integrated Session Replay capabilities
- SOC 2 Type II & HIPAA compliant
- Fast, intuitive self-serve reports
Cons
- Expensive scaling with event volume
- Steep learning curve for setup
- Engineering required for implementation
- HIPAA limited to Enterprise plan
- Support limited on lower tiers
Expert Take
Mixpanel is recognized for its advanced product analytics capabilities, offering comprehensive insights into user behavior and product usage. It is widely used by growth teams for its ability to facilitate data-driven decision-making. The platform's robust features and integration capabilities make it a strong contender in the product analytics space.

PostHog is a one-stop SaaS solution that empowers product engineers with all necessary dev tools in one place. It enables engineers to build, test, measure, and deliver successful products faster by providing an integrated environment for analytics and feature usage, addressing the unique needs of SaaS teams.
Best for Product Analytics Tools for SaaS Teams
Expert Take
PostHog stands out as a comprehensive solution for SaaS teams, offering a unique blend of analytics and feature usage tools. Its open-source availability and self-hosting options provide flexibility, while its integrated environment enhances product development efficiency. Despite potential complexity for beginners, it remains a top choice for advanced users.
Pros
- Unified platform for analytics, replays, and flags
- Open-source and self-hostable options
- SOC 2 Type II and HIPAA compliant
- Developer-centric with robust SDKs
Cons
- Steep learning curve for non-technical users
- Session replay costs scale quickly
- No support for free self-hosted instances
- Dashboard configuration can be complex
Best for teams that are
- Engineering-led teams wanting an all-in-one suite (analytics, flags, replays)
- Technical founders who prefer open-source software
Skip if
- Non-technical marketing teams who find developer-centric UIs overwhelming
- Teams wanting a purely SaaS tool without any configuration
Best for teams that are
- Engineering-led teams wanting an all-in-one suite (analytics, flags, replays)
- Technical founders who prefer open-source software
Skip if
- Non-technical marketing teams who find developer-centric UIs overwhelming
- Teams wanting a purely SaaS tool without any configuration
Pros
- Unified platform for analytics, replays, and flags
- Generous free tier (1M events/month)
- Open-source and self-hostable options
- SOC 2 Type II and HIPAA compliant
- Developer-centric with robust SDKs
Cons
- Steep learning curve for non-technical users
- Session replay costs scale quickly
- Self-hosting requires significant DevOps resources
- No support for free self-hosted instances
- Dashboard configuration can be complex
Expert Take
PostHog stands out as a comprehensive solution for SaaS teams, offering a unique blend of analytics and feature usage tools. Its open-source availability and self-hosting options provide flexibility, while its integrated environment enhances product development efficiency. Despite potential complexity for beginners, it remains a top choice for advanced users.
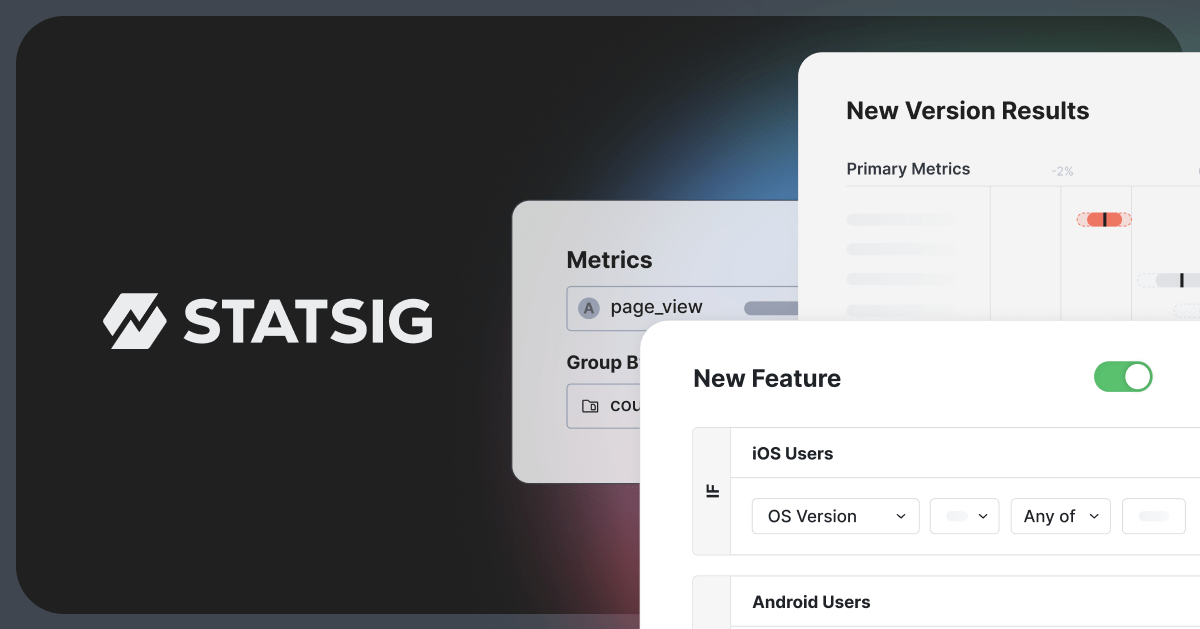
Statsig is a comprehensive data platform tailored for product development. It consolidates various tools crucial to product lifecycle management such as experimentation, analytics, feature flags, and session replays. Its ability to serve multiple needs in one platform makes it an ideal solution for industry professionals aiming to optimize and streamline their product development process.
Best for Product Analytics Tools with A B Testing
Expert Take
Statsig is a comprehensive platform that integrates multiple tools essential for product development, such as experimentation and analytics. Its scalability and integration capabilities make it a strong choice for industry professionals. However, pricing transparency could be improved, which slightly affects its overall score.
Pros
- Unlimited free feature flags
- Generous free tier (2M events/month)
- Unified experimentation and product analytics
- Proven scale (1T+ events/day)
Cons
- Steep learning curve for advanced stats
- Documentation gaps for complex features
- UI can be dense for new users
- Limited drill-down properties in some views
Best for teams that are
- Engineering-led product teams combining feature flags with A/B testing
- Teams capable of code-based implementation for deep product control
Skip if
- Non-technical marketing teams seeking a purely visual, no-code website editor
- Organizations looking for a simple, standalone marketing testing tool
Best for teams that are
- Engineering-led product teams combining feature flags with A/B testing
- Teams capable of code-based implementation for deep product control
Skip if
- Non-technical marketing teams seeking a purely visual, no-code website editor
- Organizations looking for a simple, standalone marketing testing tool
Pros
- Unlimited free feature flags
- Warehouse-native analysis prevents data egress
- Generous free tier (2M events/month)
- Unified experimentation and product analytics
- Proven scale (1T+ events/day)
Cons
- Steep learning curve for advanced stats
- Documentation gaps for complex features
- Bot detection capabilities could be stronger
- UI can be dense for new users
- Limited drill-down properties in some views
Expert Take
Statsig is a comprehensive platform that integrates multiple tools essential for product development, such as experimentation and analytics. Its scalability and integration capabilities make it a strong choice for industry professionals. However, pricing transparency could be improved, which slightly affects its overall score.

FullStory's Heatmap Analytics Platform is an innovative SaaS solution specifically designed for professionals in the product management and UX/UI design industry. This platform allows users to visualize customer engagement and behavior, thereby enabling them to enhance product design and user interface based on real-time data and insights.
Best for Product Analytics Tools with Heatmaps
Expert Take
FullStory Heatmap Analytics is a top-tier product analytics tool with heatmaps, offering robust capabilities for visualizing user behavior and engagement. It is recognized for its usability and detailed reporting, though integration limitations and enterprise pricing may affect some users. Overall, it stands out in its category for its depth and user experience.
Pros
- Autocapture tracks all events without tagging
- Industry-leading security (ISO 42001, HIPAA)
- Advanced frustration signals (Rage Clicks)
- High-fidelity session replay with DOM detail
Cons
- Steep learning curve for new users
- Pricing is opaque and enterprise-focused
- No scroll maps for native mobile apps
- Lacks built-in survey/feedback tools
Best for teams that are
- Engineering teams needing to reproduce bugs and troubleshoot UX
- Enterprises wanting high-fidelity session replay and autocapture
Skip if
- Small businesses with limited budgets due to high pricing
- Teams needing deep custom event analytics
Best for teams that are
- Engineering teams needing to reproduce bugs and troubleshoot UX
- Enterprises wanting high-fidelity session replay and autocapture
Skip if
- Small businesses with limited budgets due to high pricing
- Teams needing deep custom event analytics
Pros
- Autocapture tracks all events without tagging
- Native iOS and Android app support
- Industry-leading security (ISO 42001, HIPAA)
- Advanced frustration signals (Rage Clicks)
- High-fidelity session replay with DOM detail
Cons
- Steep learning curve for new users
- Pricing is opaque and enterprise-focused
- Expensive for small teams/startups
- No scroll maps for native mobile apps
- Lacks built-in survey/feedback tools
Expert Take
FullStory Heatmap Analytics is a top-tier product analytics tool with heatmaps, offering robust capabilities for visualizing user behavior and engagement. It is recognized for its usability and detailed reporting, though integration limitations and enterprise pricing may affect some users. Overall, it stands out in its category for its depth and user experience.

Statsig's Product Usage Analytics tool is a comprehensive solution for product managers to track and optimize engagement. It specifically addresses the needs of professionals in this industry by providing key metrics such as feature adoption, session duration, and user retention, integral for informed decision making and strategy formulation.
Best for Feature Usage Analytics for Product Managers
Expert Take
Statsig Product Usage Analytics excels in providing detailed insights into product usage, crucial for product managers. Its metrics-driven approach supports informed decision-making. However, the lack of transparent pricing and potential technical complexity may limit accessibility for some users.
Pros
- Generous free tier with 2M events/month
- Warehouse-native option prevents data silos
- Unlimited feature flags included on all plans
- Trusted by OpenAI, Notion, and Microsoft
Cons
- Steep learning curve for advanced analytics
- Sidecar feature has limitations with SPAs
- UI can feel cluttered for some users
- Newer platform than legacy analytics giants
Best for teams that are
- Engineering-led product teams combining feature flags, A/B testing, and analytics.
- Teams needing to measure the direct impact of new features on system performance.
Skip if
- Non-technical marketing teams needing simple campaign attribution or web traffic data.
- Organizations without engineering resources to manage SDKs and feature configurations.
Best for teams that are
- Engineering-led product teams combining feature flags, A/B testing, and analytics.
- Teams needing to measure the direct impact of new features on system performance.
Skip if
- Non-technical marketing teams needing simple campaign attribution or web traffic data.
- Organizations without engineering resources to manage SDKs and feature configurations.
Pros
- Generous free tier with 2M events/month
- Unified analytics, feature flags, and experimentation
- Warehouse-native option prevents data silos
- Unlimited feature flags included on all plans
- Trusted by OpenAI, Notion, and Microsoft
Cons
- Steep learning curve for advanced analytics
- Sidecar feature has limitations with SPAs
- Documentation gaps for complex configurations
- UI can feel cluttered for some users
- Newer platform than legacy analytics giants
Expert Take
Statsig Product Usage Analytics excels in providing detailed insights into product usage, crucial for product managers. Its metrics-driven approach supports informed decision-making. However, the lack of transparent pricing and potential technical complexity may limit accessibility for some users.
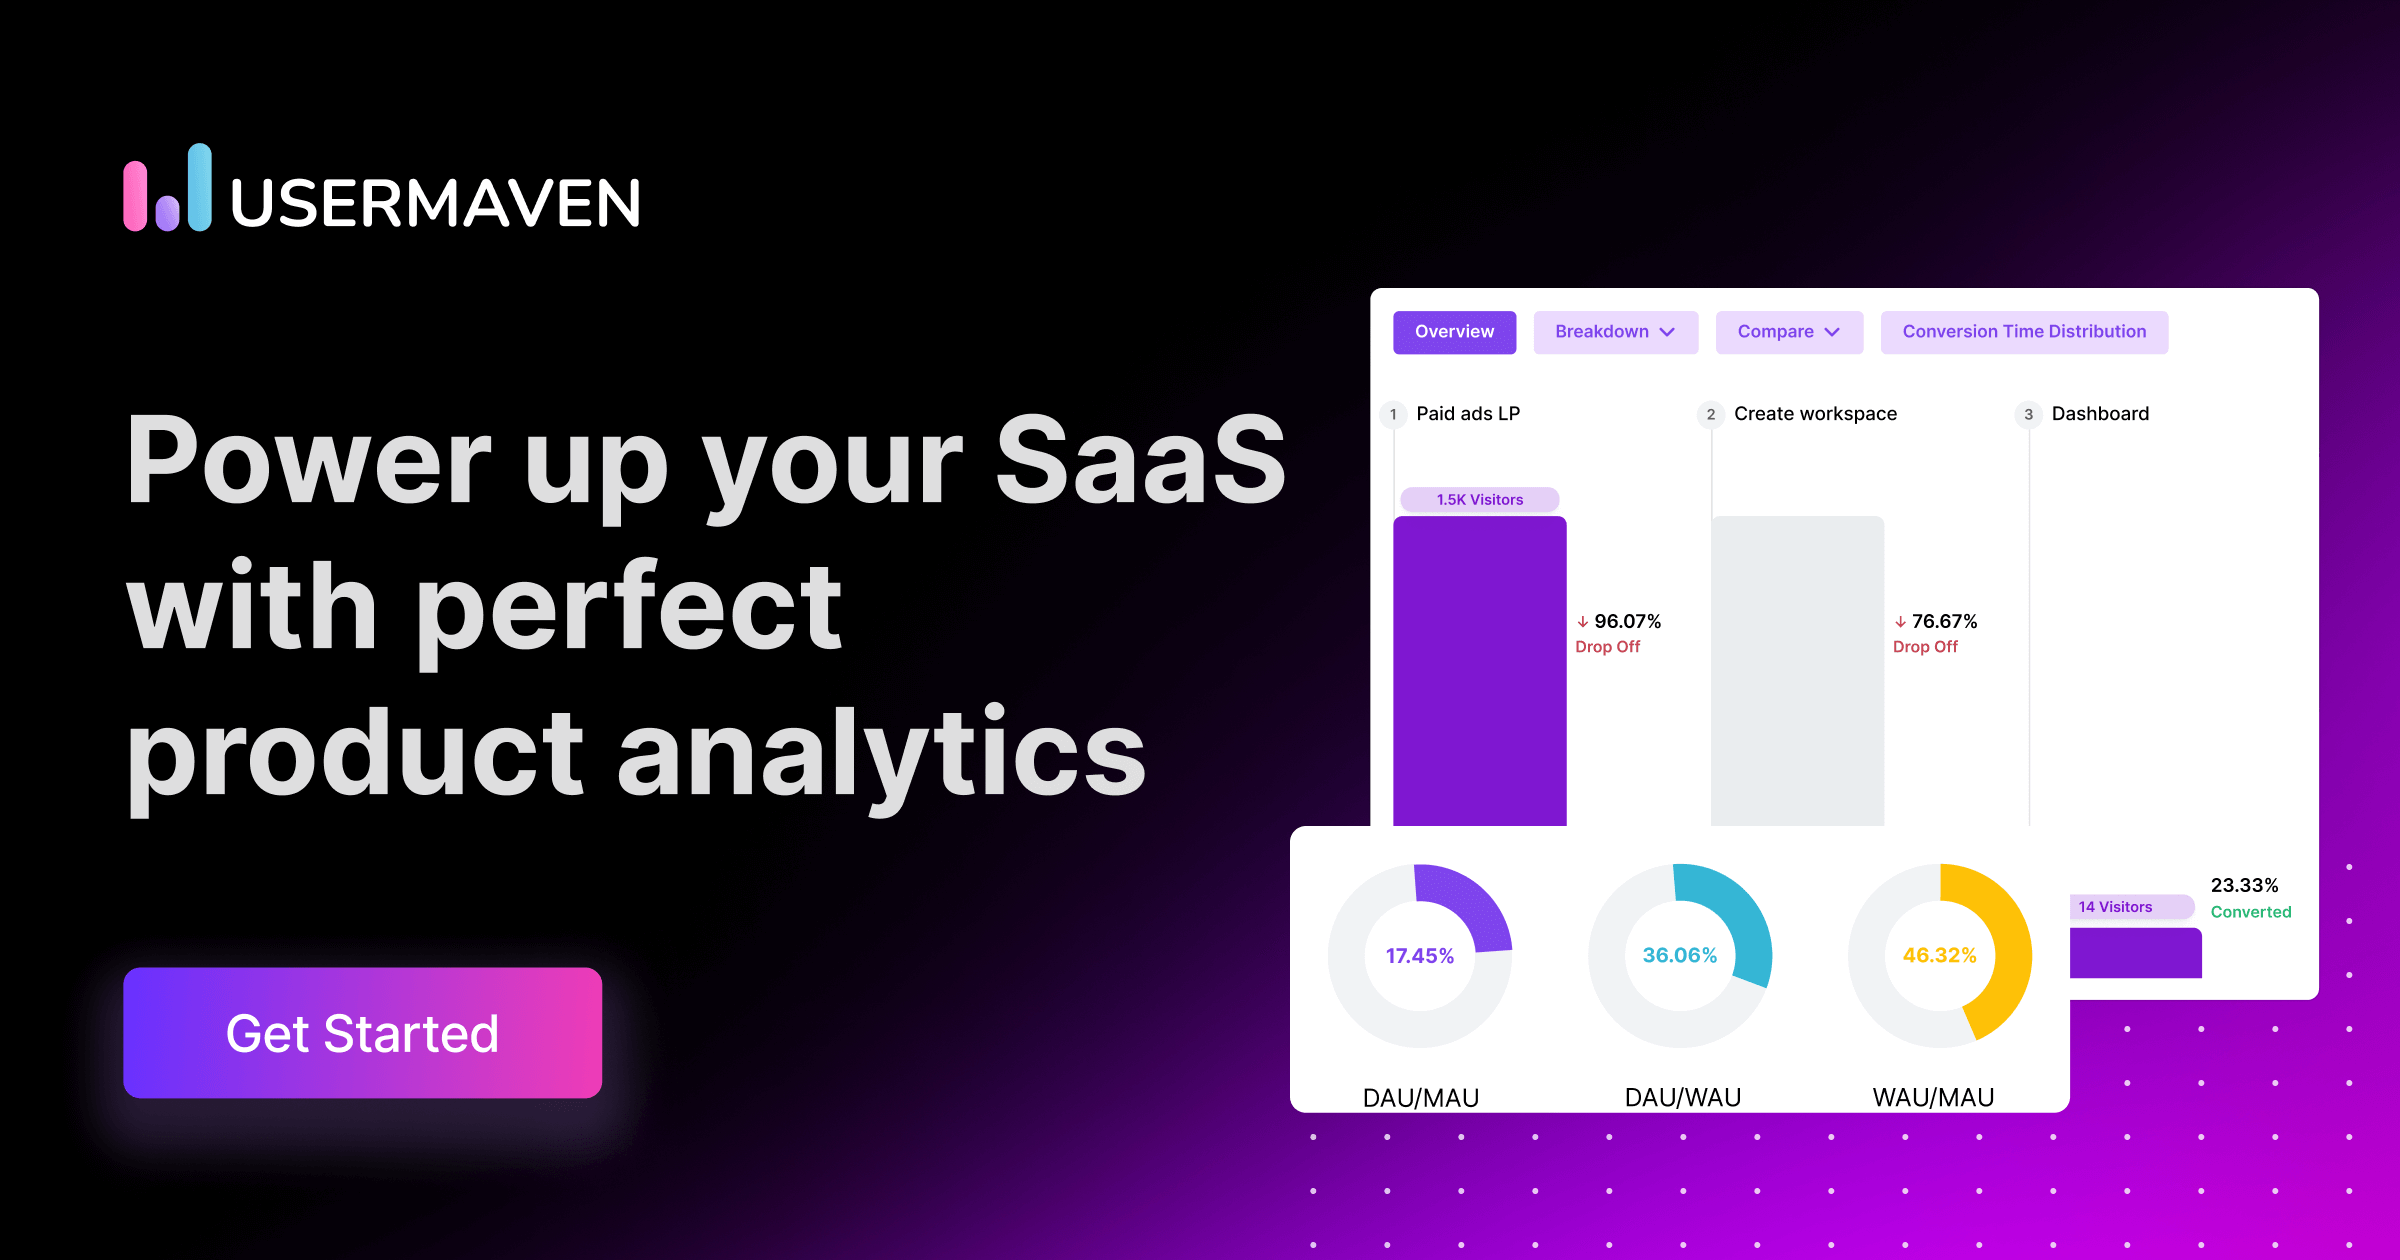
Usermaven is a comprehensive SaaS solution designed for product and marketing teams, offering actionable insights for product-led growth. Its analytics platform simplifies product data interpretation, making it an ideal tool for SaaS companies that need to understand user behavior, optimize product features, and drive growth.
Best for Product Analytics Tools for SaaS Teams
Expert Take
Usermaven Product Analytics is recognized for its comprehensive capabilities tailored for SaaS teams, providing actionable insights that drive product-led growth. Its user-friendly interface and customizable reporting enhance usability, while its market credibility is supported by third-party validations.
Pros
- Auto-capture events without coding
- Maven AI natural language queries
- Generous free tier (25k events)
- Unified product & marketing analytics
Cons
- Limited report customization options
- No multilingual dashboard support
- Attribution locked to higher tiers
- Steep learning curve for advanced features
Best for teams that are
- Privacy-focused companies needing GDPR/CCPA compliant cookieless tracking
- Teams needing a hybrid of web analytics and product analytics
Skip if
- Enterprises requiring deep SQL access and complex behavioral analysis
- Teams needing an extensive ecosystem of third-party integrations
Best for teams that are
- Privacy-focused companies needing GDPR/CCPA compliant cookieless tracking
- Teams needing a hybrid of web analytics and product analytics
Skip if
- Enterprises requiring deep SQL access and complex behavioral analysis
- Teams needing an extensive ecosystem of third-party integrations
Pros
- Auto-capture events without coding
- Privacy-first & GDPR compliant
- Maven AI natural language queries
- Generous free tier (25k events)
- Unified product & marketing analytics
Cons
- Limited report customization options
- No multilingual dashboard support
- Fewer integrations than enterprise giants
- Attribution locked to higher tiers
- Steep learning curve for advanced features
Expert Take
Usermaven Product Analytics is recognized for its comprehensive capabilities tailored for SaaS teams, providing actionable insights that drive product-led growth. Its user-friendly interface and customizable reporting enhance usability, while its market credibility is supported by third-party validations.

Relevance AI Feature Usage Analytics provides a sophisticated approach to understanding user engagement with product features. Its AI-powered analytics tools are a game-changer for product managers, providing detailed insights into how users interact with specific functionalities, aiding decision-making processes. It's tailored to fill the gap in the market for deep, data-driven understanding of feature usage.
Best for Feature Usage Analytics for Product Managers
Expert Take
Relevance AI Feature Usage Analytics excels in providing AI-powered insights into user engagement, making it a valuable tool for product managers. Its integration capabilities and real-time data collection enhance its utility, although pricing transparency could be improved. Overall, it stands out as a leading solution in feature usage analytics.
Pros
- Visual no-code builder for custom agents
- SOC 2 Type II and GDPR compliant
- Generous free tier for testing capabilities
- AI detects anomalies traditional analytics miss
Cons
- Steep learning curve for complex workflows
- Strict no-refund policy causes frustration
- Support response times can be slow
- Documentation lacks depth for advanced logic
Best for teams that are
- Teams wanting to build AI agents that automate analysis and generate insights automatically.
- Low-code builders who want to create custom workflows for tracking feature adoption.
Skip if
- Users seeking a traditional, out-of-the-box static dashboard without configuration.
- Teams with strict budgets who prefer flat-rate pricing over credit-based consumption models.
Best for teams that are
- Teams wanting to build AI agents that automate analysis and generate insights automatically.
- Low-code builders who want to create custom workflows for tracking feature adoption.
Skip if
- Users seeking a traditional, out-of-the-box static dashboard without configuration.
- Teams with strict budgets who prefer flat-rate pricing over credit-based consumption models.
Pros
- Visual no-code builder for custom agents
- 2000+ integrations via Zapier and native apps
- SOC 2 Type II and GDPR compliant
- Generous free tier for testing capabilities
- AI detects anomalies traditional analytics miss
Cons
- Steep learning curve for complex workflows
- Strict no-refund policy causes frustration
- Credit consumption can be unpredictable
- Support response times can be slow
- Documentation lacks depth for advanced logic
Expert Take
Relevance AI Feature Usage Analytics excels in providing AI-powered insights into user engagement, making it a valuable tool for product managers. Its integration capabilities and real-time data collection enhance its utility, although pricing transparency could be improved. Overall, it stands out as a leading solution in feature usage analytics.

Amplitude Experiment is a powerful A/B testing and product experimentation tool specifically designed to meet the needs of data-driven product and marketing teams. It provides a seamless experimentation environment that allows professionals to make data-led decisions, optimize user experience, and drive product growth effectively.
Best for Product Analytics Tools with A B Testing
Expert Take
Amplitude Experiment stands out as a leading product analytics tool with robust A/B testing capabilities. It excels in providing data-driven insights and a seamless user experience, making it a preferred choice for data-driven teams. Its market credibility is reinforced by third-party recognitions and partnerships.
Pros
- Unified analytics and experimentation platform
- Generous free plan with 50k MTUs
- SOC 2, ISO 27001, and HIPAA compliant
- Visual editor for non-technical users
Cons
- Steep learning curve for new users
- Expensive at scale with high event volume
- Complex setup for feature flags
- UI can be slow to navigate
Best for teams that are
- Existing Amplitude Analytics users wanting a unified data and testing platform
- Enterprises needing robust identity resolution across devices
Skip if
- Small teams with limited engineering resources for complex SDK setup
- Marketers looking for a simple drag-and-drop landing page optimizer
Best for teams that are
- Existing Amplitude Analytics users wanting a unified data and testing platform
- Enterprises needing robust identity resolution across devices
Skip if
- Small teams with limited engineering resources for complex SDK setup
- Marketers looking for a simple drag-and-drop landing page optimizer
Pros
- Unified analytics and experimentation platform
- Advanced sequential and multi-armed bandit testing
- Generous free plan with 50k MTUs
- SOC 2, ISO 27001, and HIPAA compliant
- Visual editor for non-technical users
Cons
- Steep learning curve for new users
- Expensive at scale with high event volume
- Opaque pricing for Enterprise plans
- Complex setup for feature flags
- UI can be slow to navigate
Expert Take
Amplitude Experiment stands out as a leading product analytics tool with robust A/B testing capabilities. It excels in providing data-driven insights and a seamless user experience, making it a preferred choice for data-driven teams. Its market credibility is reinforced by third-party recognitions and partnerships.

Amplitude is a comprehensive product analytics and event tracking platform perfect for growth teams in the SaaS industry. It helps businesses turn user data into actionable insights, optimizing product performance and ensuring customer-centric growth. Its robust analytics and experimentation tools are tailored to meet the complex needs of SaaS companies.
Best for Product Analytics Tools for Growth Teams
Expert Take
Amplitude is recognized for its comprehensive analytics capabilities tailored for growth teams in the SaaS industry. It offers advanced event tracking and user behavior insights, making it a leader in product analytics. Despite its complexity for beginners, its robust features and integrations justify its premium positioning.
Pros
- Generous free plan with 100k MTUs
- Integrated Session Replay for qualitative insights
- Strong SOC 2, HIPAA, and GDPR compliance
- Extensive SDK and data warehouse integrations
Cons
- Steep learning curve for advanced features
- Support can be slow on lower tiers
- Implementation requires engineering resources
- Opaque enterprise pricing structure
Best for teams that are
- Enterprise companies and fast-scaling startups with complex data needs
- Organizations with engineering resources to manage implementation and governance
Skip if
- Early-stage startups or hobbyists with limited budgets and simple products
- Teams seeking a zero-setup solution without engineering support
Best for teams that are
- Enterprise companies and fast-scaling startups with complex data needs
- Organizations with engineering resources to manage implementation and governance
Skip if
- Early-stage startups or hobbyists with limited budgets and simple products
- Teams seeking a zero-setup solution without engineering support
Pros
- Generous free plan with 100k MTUs
- Deep behavioral analytics and retention tools
- Integrated Session Replay for qualitative insights
- Strong SOC 2, HIPAA, and GDPR compliance
- Extensive SDK and data warehouse integrations
Cons
- Steep learning curve for advanced features
- Support can be slow on lower tiers
- Expensive at high scale or volume
- Implementation requires engineering resources
- Opaque enterprise pricing structure
Expert Take
Amplitude is recognized for its comprehensive analytics capabilities tailored for growth teams in the SaaS industry. It offers advanced event tracking and user behavior insights, making it a leader in product analytics. Despite its complexity for beginners, its robust features and integrations justify its premium positioning.

Attention Insight Heatmaps is an AI-driven pre-launch analytics tool specifically designed for professionals in the digital marketing and product design industry. It allows users to instantly generate AI heatmaps using predictive eye-tracking technology, helping them to understand how users view their design and thereby increase conversion rates.
Best for Product Analytics Tools with Heatmaps
Expert Take
Attention Insight Heatmaps excels in providing AI-driven predictive analytics for digital marketing and product design professionals. Its integration capabilities and detailed analytics contribute to its high usability and market credibility. However, the pricing model may be a consideration for smaller businesses.
Pros
- 90-96% accuracy validated by MIT benchmark
- Instant results without live user testing
- Includes WCAG 2.2 AA contrast analysis
- Transparent pricing with 14-day free trial
Cons
- Lacks gaze plot (viewing sequence) visualization
- Large pages may generate fragmented reports
- Does not replace qualitative user feedback
Best for teams that are
- Designers wanting predictive AI heatmaps to test concepts pre-launch
- Teams needing to validate visual hierarchy during the design phase
Skip if
- Users needing to track actual live visitor clicks and scrolls
- Post-launch analysis of real user behavior
Best for teams that are
- Designers wanting predictive AI heatmaps to test concepts pre-launch
- Teams needing to validate visual hierarchy during the design phase
Skip if
- Users needing to track actual live visitor clicks and scrolls
- Post-launch analysis of real user behavior
Pros
- 90-96% accuracy validated by MIT benchmark
- Native plugins for Figma, Adobe, and Sketch
- Instant results without live user testing
- Includes WCAG 2.2 AA contrast analysis
- Transparent pricing with 14-day free trial
Cons
- Lacks gaze plot (viewing sequence) visualization
- Large pages may generate fragmented reports
- Video analysis consumes credits per second
- Does not replace qualitative user feedback
Expert Take
Attention Insight Heatmaps excels in providing AI-driven predictive analytics for digital marketing and product design professionals. Its integration capabilities and detailed analytics contribute to its high usability and market credibility. However, the pricing model may be a consideration for smaller businesses.





Loading comparison data…