
Business Intelligence (BI) & Dashboard Tools
These are the specialized categories within Business Intelligence (BI) & Dashboard Tools. Looking for something broader? See all Business Intelligence & Analytics Software categories.

How big is your team?
What's your budget situation?
What's your team's technical comfort level?
What's the ONE thing this tool must do well?

Market Tracker 360 is a powerful business intelligence tool for ecommerce brands, transforming Amazon marketplace data into actionable insights. Ideal for brands seeking strategic market dominance, it tracks up to 15 keywords and unlimited ASINs, offering a competitive edge with real-time alerts and historical data analysis.
Best for Business Intelligence & Dashboard Tools for Ecommerce Brands
Expert Take
Market Tracker 360 transforms complex Amazon marketplace dynamics into a highly visual, actionable dashboard. By leveraging Precision+ technology to analyze millions of listings daily, it offers a distinct competitive advantage. We love its ability to track up to 15 keywords and unlimited ASINs per market alongside two years of historical data, which empowers brands to predict trends rather than just react to them. It perfectly bridges the gap between raw data and strategic market dominance.
Pros
- Tracks up to 15 keywords and unlimited ASINs per market
- Instant access to 2 years of historical data
- Real-time alerts for pricing and market shifts
Cons
- Requires an existing Helium 10 Diamond plan
- Tracking additional markets significantly increases price
Best for teams that are
- Scaling Amazon private label sellers managing multiple ASINs to grow market share.
- Brand owners wanting real-time competitor tracking and historical keyword data.
Skip if
- Beginner sellers on starter plans, as it requires a premium Diamond subscription. [cite: 43, 44]
- Users looking for a standalone tool, as it is an add-on within the Helium 10 suite. [cite: 43, 44]
Best for teams that are
- Scaling Amazon private label sellers managing multiple ASINs to grow market share.
- Brand owners wanting real-time competitor tracking and historical keyword data.
Skip if
- Beginner sellers on starter plans, as it requires a premium Diamond subscription. [cite: 43, 44]
- Users looking for a standalone tool, as it is an add-on within the Helium 10 suite. [cite: 43, 44]
Pros
- Tracks up to 15 keywords and unlimited ASINs per market
- Instant access to 2 years of historical data
- Includes a dedicated Customer Success Manager
- Real-time alerts for pricing and market shifts
Cons
- Extremely high starting cost of $500/month
- Requires an existing Helium 10 Diamond plan
- Tracking additional markets significantly increases price
Expert Take
Market Tracker 360 transforms complex Amazon marketplace dynamics into a highly visual, actionable dashboard. By leveraging Precision+ technology to analyze millions of listings daily, it offers a distinct competitive advantage. We love its ability to track up to 15 keywords and unlimited ASINs per market alongside two years of historical data, which empowers brands to predict trends rather than just react to them. It perfectly bridges the gap between raw data and strategic market dominance.
Multifamily Business Intelligence
Best for Business Intelligence & Dashboard Tools for Property Managers

This SaaS solution provides multifamily property owners, operators, and asset managers with strategic, tactical, and operational insights for informed decision-making. It offers industry-specific features that help in identifying trends, forecasting performance, and optimizing operations.
Best for Business Intelligence & Dashboard Tools for Property Managers
Expert Take
Multifamily Business Intelligence excels in providing industry-specific insights for property managers, offering robust data analytics capabilities tailored to the multifamily sector. Its strategic and operational insights are well-documented, making it a leading choice for property management professionals seeking data-driven decision-making tools.
Pros
- Single source of truth across multiple PMSs
- Antitrust-compliant 'safe' pricing model
- Deep integration with Yardi, RealPage, Entrata
- Reduces budget season time by 50%
Cons
- Requires 60-90 day implementation timeline
- Higher cost than basic reporting tools
- Dependent on source system data cleanliness
- PowerBI backend may require specialized skills
Best for teams that are
- Multifamily operators and asset managers (10,000+ units).
- Users of Yardi or Entrata seeking centralized BI.
Skip if
- Single-family rental operators or small DIY landlords.
- Those seeking a primary property management system.
Best for teams that are
- Multifamily operators and asset managers (10,000+ units).
- Users of Yardi or Entrata seeking centralized BI.
Skip if
- Single-family rental operators or small DIY landlords.
- Those seeking a primary property management system.
Pros
- Single source of truth across multiple PMSs
- Antitrust-compliant 'safe' pricing model
- Granular unit and transaction-level data access
- Deep integration with Yardi, RealPage, Entrata
- Reduces budget season time by 50%
Cons
- Requires 60-90 day implementation timeline
- Higher cost than basic reporting tools
- Dependent on source system data cleanliness
- Separate system from PMS requires maintenance
- PowerBI backend may require specialized skills
Expert Take
Multifamily Business Intelligence excels in providing industry-specific insights for property managers, offering robust data analytics capabilities tailored to the multifamily sector. Its strategic and operational insights are well-documented, making it a leading choice for property management professionals seeking data-driven decision-making tools.
Power BI Retail Data Analytics is a business intelligence tool designed to help retailers identify trends and patterns quickly and affordably. With its easy-to-use data visualization, it addresses the retail industry's needs for real-time insights to optimize sales, inventory management, and customer experience.
Best for Business Intelligence & Dashboard Tools for Retail Stores
Expert Take
Power BI Retail Data Analytics stands out in the retail business intelligence space due to its integration with Microsoft's ecosystem and its ability to provide real-time insights tailored for retail needs. Its customizable dashboards and data visualization capabilities make it a strong choice for retailers seeking to optimize operations and customer experience.
Pros
- Aggregates data from Amazon, Shopify, and POS
- Client won 'CFO of the Year' award
- Microsoft Certified Consultants ensure quality
- Scalable Azure SQL data architecture
Cons
- Custom work billed hourly ($100/hr)
- Requires separate Power BI licenses
- Implementation time varies by project scope
- Dependent on Microsoft ecosystem
Best for teams that are
- Retailers needing expert Power BI consulting and implementation
- Businesses using QuickBooks Online needing better reporting
Skip if
- DIY users wanting to build dashboards themselves from scratch
- Large enterprises with established internal BI teams
Best for teams that are
- Retailers needing expert Power BI consulting and implementation
- Businesses using QuickBooks Online needing better reporting
Skip if
- DIY users wanting to build dashboards themselves from scratch
- Large enterprises with established internal BI teams
Pros
- Aggregates data from Amazon, Shopify, and POS
- Client won 'CFO of the Year' award
- Fixed-price connector options available
- Microsoft Certified Consultants ensure quality
- Scalable Azure SQL data architecture
Cons
- Custom work billed hourly ($100/hr)
- Requires separate Power BI licenses
- Implementation time varies by project scope
- Not a standalone plug-and-play app
- Dependent on Microsoft ecosystem
Expert Take
Power BI Retail Data Analytics stands out in the retail business intelligence space due to its integration with Microsoft's ecosystem and its ability to provide real-time insights tailored for retail needs. Its customizable dashboards and data visualization capabilities make it a strong choice for retailers seeking to optimize operations and customer experience.
Power BI - Data Visualization
Best for Business Intelligence & Dashboard Tools for Marketing Agencies

Power BI is a powerful business intelligence tool that allows marketing agencies to visualize and analyze their data in a user-friendly manner. Its capabilities of integrating with various data sources and creating interactive dashboards make it ideal for this industry, where data-driven decision making is crucial.
Best for Business Intelligence & Dashboard Tools for Marketing Agencies
Expert Take
Power BI stands out as a leading tool in the business intelligence space, particularly for marketing agencies. Its integration capabilities and interactive dashboards are well-documented, making it a favorite for data-driven decision-making. While it may have a learning curve, its comprehensive features justify its premium positioning.
Pros
- Seamless integration with Microsoft 365 & Excel
- Leader in Gartner Magic Quadrant for 18 years
- Advanced AI Copilot & Fabric integration
- Massive user community and learning resources
Cons
- 40% price increase for Pro licenses (April 2025)
- Steep learning curve for DAX formulas
- Performance issues with unoptimized large datasets
- Premium features require expensive capacity upgrades
Best for teams that are
- Business analysts requiring advanced data modeling features.
- IT departments handling complex, large-scale data sources.
Skip if
- Freelance marketers needing simple, instant client reports.
- Users seeking out-of-the-box marketing agency templates.
Best for teams that are
- Business analysts requiring advanced data modeling features.
- IT departments handling complex, large-scale data sources.
Skip if
- Freelance marketers needing simple, instant client reports.
- Users seeking out-of-the-box marketing agency templates.
Pros
- Seamless integration with Microsoft 365 & Excel
- Leader in Gartner Magic Quadrant for 18 years
- Enterprise-grade security (FedRAMP, HIPAA, BYOK)
- Advanced AI Copilot & Fabric integration
- Massive user community and learning resources
Cons
- 40% price increase for Pro licenses (April 2025)
- Steep learning curve for DAX formulas
- Performance issues with unoptimized large datasets
- Complex licensing transition to Fabric capacity
- Premium features require expensive capacity upgrades
Expert Take
Power BI stands out as a leading tool in the business intelligence space, particularly for marketing agencies. Its integration capabilities and interactive dashboards are well-documented, making it a favorite for data-driven decision-making. While it may have a learning curve, its comprehensive features justify its premium positioning.

AgencyAnalytics is a dashboard and reporting tool designed specifically for marketing agencies. It provides automation for client reporting, enabling agencies to scale effectively. Key features include SEO, PPC, social media reporting, as well as bespoke dashboards, addressing the unique needs of marketing professionals.
Best for Business Intelligence & Dashboard Tools for Marketing Agencies
Expert Take
AgencyAnalytics excels as a specialized tool for marketing agencies, offering robust automated reporting and customizable dashboards. Its wide range of integrations and marketing-specific features make it a top choice in its category, despite a potential learning curve for new users.
Pros
- Automated reporting saves billable hours
- 80+ native integrations with major platforms
- Built-in SEO tools (Rank Tracker, Audit)
- Exceptional customer support response times
Cons
- API access locked behind expensive plan
- Cannot edit ad campaigns directly
- Per-client pricing scales costs quickly
- Entry plan requires 5-client minimum
Best for teams that are
- Small-to-midsize marketing agencies with 5-30 clients.
- Teams needing fast, automated white-label client reports.
Skip if
- Marketing teams needing end-to-end custom data pipelines.
- Enterprise agencies requiring deep cross-channel analysis.
Best for teams that are
- Small-to-midsize marketing agencies with 5-30 clients.
- Teams needing fast, automated white-label client reports.
Skip if
- Marketing teams needing end-to-end custom data pipelines.
- Enterprise agencies requiring deep cross-channel analysis.
Pros
- Automated reporting saves billable hours
- 80+ native integrations with major platforms
- Full white-labeling including mobile app
- Built-in SEO tools (Rank Tracker, Audit)
- Exceptional customer support response times
Cons
- API access locked behind expensive plan
- Cannot edit ad campaigns directly
- Per-client pricing scales costs quickly
- SEO tools less robust than dedicated suites
- Entry plan requires 5-client minimum
Expert Take
AgencyAnalytics excels as a specialized tool for marketing agencies, offering robust automated reporting and customizable dashboards. Its wide range of integrations and marketing-specific features make it a top choice in its category, despite a potential learning curve for new users.
Explore: Insurance BI Software
Best for Business Intelligence & Dashboard Tools for Insurance Agents

Explore is a powerful SaaS solution tailored for insurance agents. It leverages data to provide deep insights for underwriting, claims, sales, and service management decisions. The software's industry-specific features help identify trends, predict outcomes, and drive profitable growth.
Best for Business Intelligence & Dashboard Tools for Insurance Agents
Expert Take
Explore is a specialized business intelligence tool designed for insurance agents, offering deep insights into underwriting, claims, and sales management. Its industry-specific features and data-driven approach make it a valuable asset for insurance professionals. While it excels in functionality, the need for technical expertise and lack of transparent pricing are notable considerations.
Pros
- Business Impact Monitoring for predictive models
- Pre-built Financial Insights for Policy/Claims
- Drastically reduces data preparation time
- Embedded analytics in ClaimCenter workflows
Cons
- Requires Guidewire Cloud Platform
- Complex implementation requiring consultants
- Opaque enterprise pricing model
- Not a standalone BI solution
Best for teams that are
- P&C insurers running Guidewire InsuranceSuite (Policy, Claim, Billing)
- Carriers requiring comprehensive financial and operational intelligence
Skip if
- Small independent agencies or brokerages
- Insurers not using Guidewire's core policy and claims systems
Best for teams that are
- P&C insurers running Guidewire InsuranceSuite (Policy, Claim, Billing)
- Carriers requiring comprehensive financial and operational intelligence
Skip if
- Small independent agencies or brokerages
- Insurers not using Guidewire's core policy and claims systems
Pros
- Business Impact Monitoring for predictive models
- AI-powered 'Spotter' natural language search
- Pre-built Financial Insights for Policy/Claims
- Drastically reduces data preparation time
- Embedded analytics in ClaimCenter workflows
Cons
- Requires Guidewire Cloud Platform
- Complex implementation requiring consultants
- Custom fields need Data Studio config
- Opaque enterprise pricing model
- Not a standalone BI solution
Expert Take
Explore is a specialized business intelligence tool designed for insurance agents, offering deep insights into underwriting, claims, and sales management. Its industry-specific features and data-driven approach make it a valuable asset for insurance professionals. While it excels in functionality, the need for technical expertise and lack of transparent pricing are notable considerations.

Designed for data-driven investors, MarketXLS integrates seamlessly with Excel, providing live market data and advanced metrics. It transforms spreadsheets into a powerful financial terminal, offering substantial cost savings over traditional systems.
Best for Business Intelligence & Dashboard Tools for Ecommerce Brands
Expert Take
MarketXLS seamlessly transforms standard spreadsheets into an institutional-grade financial terminal without the exorbitant costs of legacy systems like YCharts or Bloomberg. By bringing live market data, advanced options Greeks, and comprehensive historical metrics directly into Excel cells via intuitive functions, it empowers data-driven investors to build dynamic, automated models. The massive library of unlocked templates further accelerates analysis, making it an indi
Pros
- Native Excel integration with over 1,000 functions
- Institutional-grade options data with real-time Greeks
- Covers stocks, ETFs, mutual funds, and crypto
- Massive cost savings compared to legacy terminals
Cons
- Requires existing proficiency in Microsoft Excel
- Strict refund policy applies only to annual plans
- Live quote streaming can disrupt manual cell copying
Best for teams that are
- DIY investors and finance pros wanting real-time stock analytics native to Excel.
- Small business owners building financial models without learning new software.
Skip if
- Traders needing comprehensive mobile tracking, as mobile features are limited. [cite: 7]
- Those seeking a fully automated, standalone web-based BI platform. [cite: 8]
Best for teams that are
- DIY investors and finance pros wanting real-time stock analytics native to Excel.
- Small business owners building financial models without learning new software.
Skip if
- Traders needing comprehensive mobile tracking, as mobile features are limited. [cite: 7]
- Those seeking a fully automated, standalone web-based BI platform. [cite: 8]
Pros
- Native Excel integration with over 1,000 functions
- Institutional-grade options data with real-time Greeks
- Hundreds of unlocked, customizable pre-built templates
- Covers stocks, ETFs, mutual funds, and crypto
- Massive cost savings compared to legacy terminals
Cons
- Requires existing proficiency in Microsoft Excel
- Strict refund policy applies only to annual plans
- Live quote streaming can disrupt manual cell copying
- Less suitable for high-speed intraday day traders
Expert Take
MarketXLS seamlessly transforms standard spreadsheets into an institutional-grade financial terminal without the exorbitant costs of legacy systems like YCharts or Bloomberg. By bringing live market data, advanced options Greeks, and comprehensive historical metrics directly into Excel cells via intuitive functions, it empowers data-driven investors to build dynamic, automated models. The massive library of unlocked templates further accelerates analysis, making it an indi
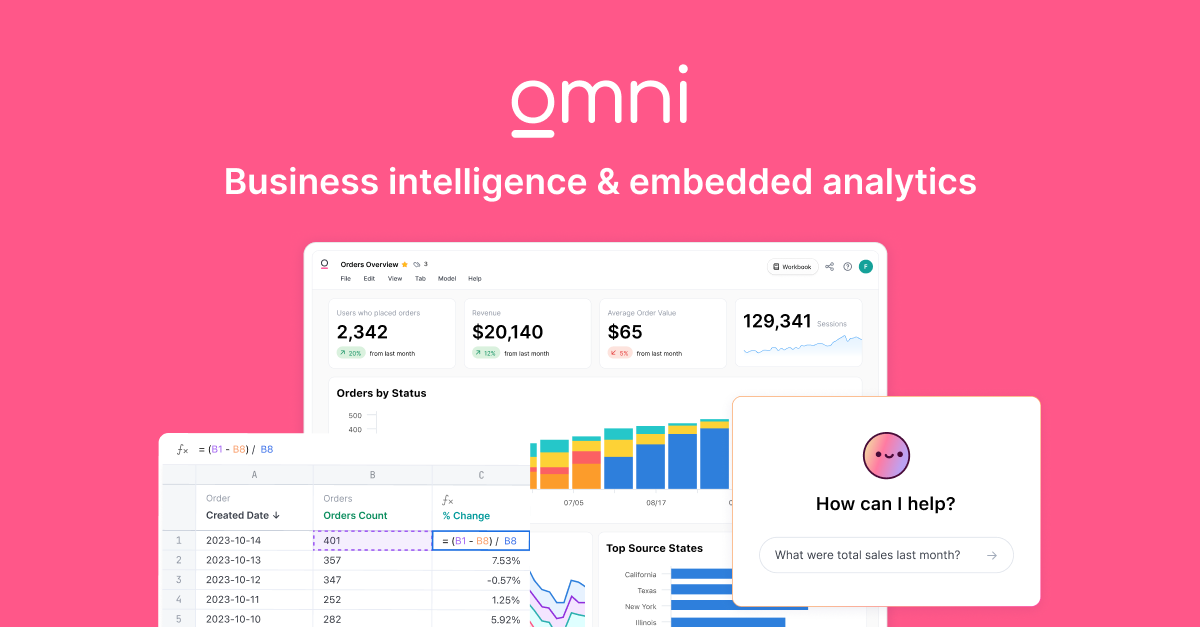
Omni Analytics is a powerful business intelligence tool specifically designed for e-commerce brands. It offers an intuitive platform that allows users to easily analyze data through spreadsheets, SQL, and AI capabilities, enabling fast, precise decisions for increased business growth.
Best for Business Intelligence & Dashboard Tools for Ecommerce Brands
Expert Take
Omni Analytics excels as a business intelligence tool for e-commerce brands due to its AI-driven data analysis capabilities and e-commerce centric features. While it offers comprehensive data handling and insights, its lack of transparent pricing and limited integration options are notable tradeoffs.
Pros
- Bi-directional dbt integration
- Unified SQL and spreadsheet UI
- Exceptional customer support
- Fast iteration speed
Cons
- Visualization options less mature
- Occasional bugs and rough edges
- Opaque pricing structure
- Limited predictive analytics features
Best for teams that are
- B2B teams needing governed metrics and semantic-layer-aware AI.
- Companies wanting self-serve SQL analysis and live cloud warehouse connectivity.
Skip if
- Organizations wanting traditional dashboards without a semantic layer. [cite: 1, 3]
- Users who prefer code-first, ad-hoc SQL notebook workflows like Mode. [cite: 3]
Best for teams that are
- B2B teams needing governed metrics and semantic-layer-aware AI.
- Companies wanting self-serve SQL analysis and live cloud warehouse connectivity.
Skip if
- Organizations wanting traditional dashboards without a semantic layer. [cite: 1, 3]
- Users who prefer code-first, ad-hoc SQL notebook workflows like Mode. [cite: 3]
Pros
- Bi-directional dbt integration
- Unified SQL and spreadsheet UI
- Just-in-time data modeling
- Exceptional customer support
- Fast iteration speed
Cons
- Visualization options less mature
- Occasional bugs and rough edges
- Opaque pricing structure
- Steep learning curve for modeling
- Limited predictive analytics features
Expert Take
Omni Analytics excels as a business intelligence tool for e-commerce brands due to its AI-driven data analysis capabilities and e-commerce centric features. While it offers comprehensive data handling and insights, its lack of transparent pricing and limited integration options are notable tradeoffs.

The Semrush Agency Growth Kit transforms digital marketing agencies into enterprise-level entities by offering white-label reporting, a secure client portal, and automated lead generation. It's perfect for agencies seeking to streamline operations and enhance their brand experience using Semrush's top-tier data.
Best for Business Intelligence & Dashboard Tools for Marketing Agencies
Expert Take
The Semrush Agency Growth Kit elevates a standard SEO toolkit into a comprehensive agency management ecosystem. By combining robust white-label reporting, a secure client portal, and automated lead generation into one platform, it drastically reduces context-switching. It enables growing digital marketing agencies to present an enterprise-level brand experience while leveraging Semrush's industry-leading data.
Pros
- Fully white-labeled client portals
- Integrated CRM and lead finder
- Access to Agency Partners directory
Cons
- Requires expensive base subscription
- Steep learning curve for beginners
- Variable inbound lead quality
Best for teams that are
- Large agencies needing depth, scale, and branded reports.
- Agencies focusing heavily on comprehensive search marketing.
Skip if
- Specialized teams needing only basic backlink checking.
- Small, budget-conscious agencies needing simple reporting.
Best for teams that are
- Large agencies needing depth, scale, and branded reports.
- Agencies focusing heavily on comprehensive search marketing.
Skip if
- Specialized teams needing only basic backlink checking.
- Small, budget-conscious agencies needing simple reporting.
Pros
- Fully white-labeled client portals
- Automated branded reporting delivery
- Integrated CRM and lead finder
- Access to Agency Partners directory
Cons
- Requires expensive base subscription
- Steep learning curve for beginners
- Cluttered user interface
- Variable inbound lead quality
Expert Take
The Semrush Agency Growth Kit elevates a standard SEO toolkit into a comprehensive agency management ecosystem. By combining robust white-label reporting, a secure client portal, and automated lead generation into one platform, it drastically reduces context-switching. It enables growing digital marketing agencies to present an enterprise-level brand experience while leveraging Semrush's industry-leading data.

Spider Impact's BI Tools are specifically designed to cater to the needs of contractors. These tools allow for data visualization through intuitive dashboards, and the tracking of performance with automated KPIs, enabling contractors to monitor project progress, cost, and time management efficiently.
Best for Business Intelligence & Dashboard Tools for Contractors
Expert Take
Spider Impact BI Tools excel in providing tailored business intelligence solutions for contractors, offering intuitive dashboards and automated KPI tracking. While enterprise-level pricing and technical proficiency requirements may pose challenges, the product's capabilities and market credibility make it a top choice in its category.
Pros
- Native Balanced Scorecard support
- AI-powered 'Impact Assistant'
- Meeting Mode for briefings
- Links KPIs to initiatives
Cons
- Limited visualization customization
- Steeper learning curve initially
- Niche focus (not general BI)
Best for teams that are
- Government, non-profit, and enterprise sectors needing accountability
- Executives tracking long-term strategic initiatives over operational metrics
Skip if
- Contractors looking for specific project management or field dashboards
- Teams wanting plug-and-play construction ERP integrations
Best for teams that are
- Government, non-profit, and enterprise sectors needing accountability
- Executives tracking long-term strategic initiatives over operational metrics
Skip if
- Contractors looking for specific project management or field dashboards
- Teams wanting plug-and-play construction ERP integrations
Pros
- FedRAMP Authorized security
- Native Balanced Scorecard support
- AI-powered 'Impact Assistant'
- Meeting Mode for briefings
- Links KPIs to initiatives
Cons
- Limited visualization customization
- UI described as dated
- Steeper learning curve initially
- Niche focus (not general BI)
Expert Take
Spider Impact BI Tools excel in providing tailored business intelligence solutions for contractors, offering intuitive dashboards and automated KPI tracking. While enterprise-level pricing and technical proficiency requirements may pose challenges, the product's capabilities and market credibility make it a top choice in its category.
Explore Categories
-
 Business Intelligence & Dashboard Tools for Contractors
-
 Business Intelligence & Dashboard Tools for Ecommerce Brands
-
 Business Intelligence & Dashboard Tools for Insurance Agents
-
 Business Intelligence & Dashboard Tools for Marketing Agencies
-
 Business Intelligence & Dashboard Tools for Property Managers
-
 Business Intelligence & Dashboard Tools for Retail Stores
Loading comparison data…
Business Intelligence & Dashboard Tools for Contractors
Business Intelligence & Dashboard Tools for Ecommerce Brands
Business Intelligence & Dashboard Tools for Insurance Agents
Business Intelligence & Dashboard Tools for Marketing Agencies
Business Intelligence & Dashboard Tools for Property Managers
Business Intelligence & Dashboard Tools for Retail Stores