1. Home
  2. Business Intelligence & Analytics
  3. Marketing Attribution & Analytics Platforms

Category · Business Intelligence & Analytics Software

Marketing Attribution & Analytics Platforms

Marketing Analytics & Attribution Tools are essential for business professionals seeking to optimize their marketing strategies and accurately measure campaign effectiveness. This category is designed for marketers, data analysts, and business intelligence teams who require detailed insights into customer journeys and the impact of marketing efforts on sales.

4 rankings35 products scored6 criteria eachUpdated Aug 17, 2026
01

Top picks across Marketing Attribution & Analytics Platforms

The highest scorer from each vendor across all 4 rankings. Six little boxes show each one against its ranking average, and the full review sits under each card.

1

ZeroBounce

zerobounce.net · Activity Data #1 of 14 in Marketing Analytics Platforms for Ecommerce Brands

ZeroBounce tracks opens for a year, now forces bundles.

Best forEmail marketers targeting active subscribers and improving deliverability.

Quote only HIPAASOC 2email marketing
Top of its ranking

Email appending tool that flags subscriber opens, clicks, and unsubscribes over up to 365 days.

Standout factActivity Data segments engagement into timeframes of 30, 60, 90, 180, or 365 days. zerobounce.net
Biggest catchUsers report being forced into bloated subscription bundles with unused features. g2.com
500,000+Customers servedzerobounce.net
4.8/5 (2,000+ reviews)Review ratingverified.email
60+Native integrationsverified.email

Standout number

365 daysmaximum engagement tracking window

Source: zerobounce.net

Compliance

✓ SOC 2 Type 2✓ ISO 27001✓ HIPAA

Source: zerobounce.net

Upside

  • Tracks engagement up to 365 days
  • SOC 2, ISO 27001, HIPAA certified
  • 60+ native integrations

Catch

  • Mandatory subscription bundles
  • Activity Data needs premium credits
  • Interface can overwhelm simple users
Pick it ifEmail marketers targeting active subscribers and improving deliverability.
Skip it ifCompanies that do not rely on email marketing.
PricingCredit-based subscription bundles, contact for pricing

Editor's takeZeroBounce Activity Data helps marketers separate engaged subscribers from dead weight across timeframes up to a year. Security credentials are extensive, spanning SOC 2, ISO 27001, and HIPAA compliance. Buyers should read the pricing fine print, since G2 reviewers report being pushed into feature-bloated bundles.

What does ZeroBounce Activity Data track?

It flags whether subscribers opened, clicked, forwarded, or unsubscribed from emails, segmented into 30, 60, 90, 180, or 365-day windows.

Is ZeroBounce's pricing transparent?

Reviewers report the company recently shifted to mandatory subscription bundles that include unused features, which reduces pricing flexibility for buyers.

The evidence: 6 criteria, 2 penalties
9.6
Product Capability & DepthLooked for: Comprehensive email appending features that accurately match active users based on verifiable engagement metrics.ZeroBounce Activity Data identifies if subscribers opened, clicked, forwarded, or unsubscribed from emails. It segments these engagement metrics into actionable timeframes of 30, 60, 90, 180, or 365 days to help target active users.zerobounce.net
9.4
Market Credibility & Trust SignalsLooked for: Documented trust from established brands and highly consistent, positive ratings on major software review platforms.ZeroBounce serves over 500,000 customers, including major enterprise brands like Amazon, Disney, Netflix, and Sephora. It maintains a stellar 4.8 out of 5-star rating across major review platforms based on thousands of reviews.verified.email
9.3
Usability & Customer ExperienceLooked for: An intuitive interface that allows users to easily upload lists, append activity data, and seamlessly export results.The platform offers a professional, data-rich dashboard where adding Activity Data is as simple as ticking a box before download. However, the abundance of features presents a learning curve for users wanting simple list cleaning.verified.email
8.7
Value, Pricing & TransparencyLooked for: Clear, flexible, and transparent pricing models that offer good ROI without hidden fees or forced bundling.While basic verification is credit-based, Activity Data requires premium credits. Furthermore, users have heavily criticized the company's recent shift toward forcing customers into bloated subscription bundles containing unused features.g2.com
9.5
Security, Compliance & Data ProtectionLooked for: Enterprise-grade security certifications and strict adherence to global data privacy laws to protect uploaded contact lists.ZeroBounce utilizes proprietary hardware and holds an exhaustive list of certifications, including SOC 2 Type 2, ISO 27001, and HIPAA. It is fully compliant with global privacy frameworks like GDPR, CCPA, and PCI-DSS.zerobounce.net
9.2
Integrations & Ecosystem StrengthLooked for: Native connections to popular marketing, CRM, and sales platforms that allow for automated data enrichment.ZeroBounce offers over 60 native integrations, including major platforms like HubSpot, Mailchimp, Salesforce, and Monday.com. These integrations allow users to automatically append Activity Data directly within their existing tech stacks.verified.email

Score adjustments−0.10 points in total

−0.05Forced subscription bundles containing unnecessary features, leading to increased costs for users.g2.com · severity 75/100
−0.05Steep learning curve and complex interface for users only seeking basic list cleaning.verified.email · severity 45/100
2

Attribuly

attribuly.com · Attribuly Attribution #2 of 14 in Marketing Analytics Platforms for Ecommerce Brands

Attribuly unmasks anonymous shoppers, but credits burn fast.

Best forShopify merchants running Meta or Google ads who use Klaviyo.

From $49 per month Shopify appKlaviyo integrationserver-side tracking
#2 in its ranking

Shopify attribution app that de-anonymizes shoppers and feeds their data straight into Klaviyo flows.

Standout factDrops unknown traffic sources from 50 percent to 10 percent for European stores. attribuly.com
Biggest catchAppSumo lifetime buyers found key features locked behind a $249-a-month Pro plan. appsumo.com
4.7/5Shopify App Store ratingapps.shopify.com
50% to 10%Unknown traffic reductionattribuly.com
$249/monthPro plan priceappsumo.com

What reviewers say

Shopify App Store
4.7/5 · 143

Source: apps.shopify.com

The thing people get wrong

Attribuly pricing is a flat monthly fee

Billing is credit-based per event. Capturing one anonymous email costs 600 credits

Source: attribuly.com

Upside

  • De-anonymizes shoppers for Klaviyo
  • First-party server-side tracking
  • Bypasses iOS 14.5 restrictions

Catch

  • Event-based credits scale quickly
  • Advanced features locked in Pro
  • No Zapier or public API
Pick it ifShopify merchants running Meta or Google ads who use Klaviyo.
Skip it ifNon-Shopify stores, or brands not running paid ads or email.
PricingFrom $49/month, 14-day free trial, no free plan.

Editor's takeAttribuly ranks first among 14 tools in this category at 9.2 overall. Its identity resolution for abandoned carts is the clearest differentiator, feeding directly into Klaviyo to trigger recovery flows. Credit-based billing is the tradeoff, since heavy event volume can push costs up fast.

What does Attribuly's credit-based pricing mean?

All billing runs on events. Capturing one anonymous email costs 600 credits, so pricing scales with traffic and event volume rather than a flat monthly fee.

Does Attribuly work with platforms other than Shopify?

It supports 20 integrations including WooCommerce and Shopline, alongside Google Ads, Meta, TikTok Ads, and Klaviyo, according to Attribuly's integrations list.

The evidence: 6 criteria, 1 penalty
9.7
Product Capability & DepthLooked for: Comprehensive tracking, identity resolution, and multi-touch attribution capabilities tailored for e-commerce platforms.Attribuly provides advanced server-side tracking, identity resolution for abandoned carts, and precise multi-touch attribution, heavily optimizing Klaviyo flows and true ROAS calculations.attribuly.comsupport.attribuly.com
9.6
Market Credibility & Trust SignalsLooked for: Strong user reviews, verified case studies, and official platform partnerships or recognitions.Attribuly is a featured Shopify app trusted by over 20,000 brands, holding a 4.7 out of 5-star rating across 143 verified reviews on the Shopify App Store.attribuly.comapps.shopify.com
9.1
Usability & Customer ExperienceLooked for: Intuitive onboarding, frictionless integration without heavy coding, and responsive customer support.Merchants report a 5-minute, zero-code setup with seamless Shopify integration and praise the highly responsive customer support team.attribuly.comapps.shopify.com
8.6
Value, Pricing & TransparencyLooked for: Clear, transparent pricing models that offer proportional value to features without hidden costs or sudden paywalls.Pricing is event-based using a credit system, which can scale expensively. Lifetime deal buyers reported frustration when key features were paywalled.attribuly.comappsumo.com
9.3
Integrations & Ecosystem StrengthLooked for: Broad and deep connectivity with top ad networks, e-commerce platforms, and marketing automation tools.Attribuly natively integrates with 20 major platforms including Shopify, WooCommerce, Meta, Google Ads, TikTok, Klaviyo, and Google Analytics 4.attribuly.comattribuly.com
8.3
Data Tracking & AccuracyLooked for: Reliable first-party data collection, server-side tracking, and resistance to ad blockers or iOS privacy updates.It effectively bypasses iOS 14.5 restrictions using first-party cookies and server-side tracking, massively reducing unknown traffic sources.beikeshop.comattribuly.com

Score adjustments−0.05 points in total

−0.05AppSumo lifetime deal purchasers reported misleading marketing, finding critical functionality gated behind a steep $249/month Pro plan upgrade.appsumo.com · severity 65/100
3

Market Tracker 360

helium10.com #3 of 14 in Marketing Analytics Platforms for Ecommerce Brands

Market Tracker 360 costs $500/mo, excluded from all plans

Best forHigh-volume Amazon FBA sellers tracking competitors at scale

From $500 per month Amazon competitor trackingreal-time pricing alertspremium add-on
#3 in its ranking

Real-time Amazon competitor tracking add-on with 2 years of historical market data and unlimited ASINs.

Standout factBrainlabs reportedly saved $50,000 in ad spend in one month using Market Tracker 360's trend data. growthdevil.com
Biggest catchMarket Tracker 360 is excluded from every Helium 10 plan, including Diamond and Enterprise, and starts at $500/mo. revenuegeeks.com
$500/moStarting pricerevenuegeeks.com
2 yearsHistorical datahelium10.com
$50,000Reported ad spend savedgrowthdevil.com

Starting price

$500/mo5 markets, 1 region; excluded from all Helium 10 plans

What changed

$50,000ad spend saved in one month (Brainlabs case study)

Source: growthdevil.com

Upside

  • Unlimited ASIN tracking
  • 2 years of historical data
  • Dedicated Customer Success Manager

Catch

  • $500/mo minimum, no base plan included
  • Limited chart customization
  • Single-region pricing adds up fast
Pick it ifHigh-volume Amazon FBA sellers tracking competitors at scale
Skip it ifShopify-only DTC brands or new sellers on a budget
PricingFrom $500/mo (5 markets), excluded from all base plans

Editor's takeMarket Tracker 360 fits high-volume Amazon sellers who need real-time competitor pricing and two years of trend data. It plugs directly into Helium 10's Cerebro and Magnet for keyword research without leaving the dashboard. New sellers or Shopify-only DTC brands will likely find the $500 monthly minimum hard to justify.

Is Market Tracker 360 included in Helium 10 plans?

No. It is excluded from all Helium 10 subscription tiers, including Free, Starter, Platinum, Diamond, and Enterprise, and costs a minimum of $500 per month separately.

How much historical data does Market Tracker 360 show?

Users can access up to 2 years of historical Amazon marketplace data to analyze long-term category and pricing trends.

The evidence: 6 criteria, 2 penalties
9.5
Product Capability & DepthLooked for: We evaluate the breadth of market tracking features, including historical data access and keyword tracking capacity for enterprise Amazon sellers.Market Tracker 360 enables the tracking of unlimited ASINs and up to 15 keywords per custom market. It monitors millions of Amazon listings in real time to capture pricing, stock availability, and sales volume. Additionally, users can access up to 2 years of historical marketplace data to analyze long-term category trends.helium10.comrevenuegeeks.com
9.4
Market Credibility & Trust SignalsLooked for: We look for verified case studies, official partnerships, and expert support that validate the tool's effectiveness in the e-commerce sector.Helium 10 is widely recognized as an industry leader, and Market Tracker 360 is backed by significant documented success stories, such as the digital marketing agency Brainlabs saving $50K in ad spend in a single month. Furthermore, every user is assigned a personal Customer Success Manager to ensure optimal setup and utilization.growthdevil.comhelium10.com
9.0
Usability & Customer ExperienceLooked for: We assess the interface intuitiveness, ease of market setup, and the quality of data presentation for daily operations.Users report that creating new custom markets is incredibly fast, often taking just a few minutes with options for manual entry or suggested lists. The dashboard provides an intuitive overview of key metrics and real-time alerts. However, reviews note that the tool has limited graphical data presentation options, lacking customizable visual charts.revenuegeeks.comrevenuegeeks.com
8.6
Value, Pricing & TransparencyLooked for: We analyze the overall cost, pricing clarity, and whether the feature set justifies the required financial investment for sellers.Market Tracker 360 is positioned as a premium add-on, starting at $500 per month for up to five markets in a single region. It is explicitly excluded from all base Helium 10 subscriptions. Users have cited this massive recurring cost and the lack of an annual discount plan as significant financial drawbacks.revenuegeeks.comrevenuegeeks.com
9.4
Integrations & Ecosystem StrengthLooked for: We verify how well the tool connects with other software and the broader Helium 10 suite to create a seamless seller workflow.The tool integrates flawlessly with Helium 10's core functionalities, specifically Cerebro and Magnet, allowing users to pull high-quality keyword suggestions and reverse ASIN data directly into their market views. Additionally, tracking data can be easily exported for offline analysis or use in external spreadsheet software.helium10.comrevenuegeeks.com
9.6
Data Accuracy & Real-Time AnalyticsLooked for: We examine the precision, granularity, and timeliness of the competitive intelligence data provided to users.The platform's algorithm pulls publicly available Amazon data daily via API calls based on organic demand and customer behavior. It provides real-time tracking of competitor price drops, sales spikes, and stock changes. Reviewers consistently praise the tool for delivering live, highly accurate data rather than outdated market snapshots.jordiob.comscribehow.com

Score adjustments−0.10 points in total

−0.05The software is explicitly excluded from all Helium 10 base plans and costs an expensive minimum of $500/month as a standalone add-on.revenuegeeks.com · severity 75/100
−0.05Users note a lack of custom visualization tools, such as the ability to create personalized pie charts and color-coded graphs.revenuegeeks.com · severity 45/100
4

Recurly

recurly.com · Recurly Subscription Management #1 of 7 in Analytics Tools for Subscription and Recurring Revenue Brands

Recurly recovered $794M in revenue, but charges 1.25% per transaction

Best forMid-to-large subscription businesses scaling billing across many currencies

From $249 per month SOC 2PCI-DSSenterprise
Top of its ranking

Subscription billing platform with machine-learning retries built to recover failed payments at scale.

Standout factRecurly recovered over $794 million in revenue for customers in 2021 recurly.com
Biggest catchTransaction fees of 1.25% plus $0.10 apply on top of plan costs. withorb.com
$794MRevenue recovered in 2021recurly.com
12.7%Average revenue liftrecurly.com
$15B+Annual payment volumeg2.com

By the numbers

$794Mrevenue recovered for customers in 2021
12.7%average subscription revenue lift
$15B+annual payment volume processed

Source: recurly.com

True monthly cost

True monthly cost example

Starter plan$249
Transaction fee1.25% + $0.10/txn
Total$249 + fees

Vendor and third-party pricing pages

Upside

  • Recovered $794M in revenue in 2021
  • Supports 140+ currencies and 30+ gateways
  • PCI-DSS Level 1 and SOC 2 certified

Catch

  • Transaction fees on top of plan cost
  • Reporting features lack depth
  • Expensive for early-stage startups
Pick it ifMid-to-large subscription businesses scaling billing across many currencies
Skip it ifEarly-stage startups with low revenue facing high monthly costs
PricingStarter from $249/month plus 1.25% + $0.10 per transaction

Editor's takeRecurly's revenue recovery numbers are specific and sourced, a 12.7% average lift and $794 million recovered in 2021 alone. That machine-learning retry logic, split from dunning, is the real differentiator here. The tradeoff is cost, since monthly plans start at $249 and still carry a per-transaction fee on top.

How much does Recurly cost?

The Starter plan begins around $249 a month. Recurly also charges 1.25% plus $0.10 per transaction on card, PayPal and Amazon payments.

How does Recurly reduce failed payments?

It separates dunning from smart retry logic and uses machine learning to time retries, delivering a documented 12.7% average lift in subscription revenue.

The evidence: 6 criteria, 3 penalties
9.3
Product Capability & DepthLooked for: We evaluate the breadth of subscription management features, including billing models, gateway support, and flexibility in plan configuration.Recurly offers a comprehensive suite for subscription lifecycle management, supporting over 140 currencies, 18 languages, and integrations with 30+ payment gateways to handle complex global billing scenarios.recurly.comrecurly.comrecurly.com
9.5
Market Credibility & Trust SignalsLooked for: We assess the vendor's industry standing, client base, and proven track record in processing significant transaction volumes.Recurly is a market leader trusted by major enterprise brands like Twitch and Paramount+, processing over $15 billion in payment volume annually.businesswire.comg2.comg2.com
8.9
Usability & Customer ExperienceLooked for: We look for ease of setup, intuitive interface design, and the quality of customer support resources available to users.Users consistently praise the platform for being easy to set up and use, with responsive human support, though some find the reporting interface overly complex.recurly.comg2.comg2.com
8.5
Value, Pricing & TransparencyLooked for: We evaluate the transparency of pricing models, the presence of hidden fees, and the overall value proposition for different business sizes.Recurly uses a tiered pricing model that includes transaction fees, which some smaller businesses find expensive, and higher-tier pricing is not publicly transparent.recurly.comtrustradius.comwithorb.com
9.4
Revenue Recovery & Churn ManagementLooked for: We examine the platform's ability to reduce involuntary churn through automated dunning, smart retries, and card updater services.Recurly employs machine learning for intelligent retries and separates dunning from retry logic, delivering a documented 12.7% average lift in subscription revenue.recurly.comrecurly.comrecurly.com
9.6
Security, Compliance & Global ReachLooked for: We assess the platform's adherence to global security standards (PCI-DSS, SOC 2) and its ability to handle cross-border compliance.Recurly maintains PCI-DSS Level 1 and SOC 2 compliance while supporting complex global tax and privacy regulations like GDPR and CCPA across 195 countries.recurly.comrecurly.comdocs.recurly.com

Score adjustments−0.15 points in total

−0.06Users consistently report that reporting and analytics features are not robust enough, feel overly complicated, and lack basic reports.g2.com · severity 60/100
−0.04The pricing structure is viewed as expensive for startups, and the inclusion of transaction fees (1.25% + $0.10) adds to the total cost of ownership.withorb.com · severity 50/100
−0.05Non-admin users face access limitations that hinder customer support tasks, such as viewing add-on products or detailed reports.unibee.dev · severity 40/100
5

AdBeacon

adbeacon.com #1 of 8 in Cross Channel Marketing Analytics Dashboards

First-party tracking beats iOS14 loss, but price scales with revenue.

Best forE-commerce media buyers and agencies needing accurate post-iOS14 attribution.

From $299 per month first-party dataShopifyagency tools
Top of its ranking

Attribution dashboard unifying Google, Meta, Amazon, and TikTok ad data using first-party store data.

Standout factStandard pricing starts at $299 per month for stores under $50k in monthly revenue. smbguide.com
Biggest catchPricing is revenue-based, so software cost rises automatically as the business grows. smbguide.com
$299/moStarting pricesmbguide.com
8.6/10SMB Guide ratingsmbguide.com
4.5/5Tenere ratingadbeacon.tenereteam.com

What it costs as you grow

$2990-50k revenue
$39950k-100k revenue
$499100k-200k revenue
$599200k-300k revenue

Source: smbguide.com

Connects to

ShopifyWooCommerceBigCommerceMeta AdsGoogle AdsAmazon AdsTikTok7+ total

Source: discovermybusiness.co

Upside

  • First-party tracking beats iOS14 data loss
  • Unifies Google, Meta, Amazon, TikTok data
  • Deep native Shopify integration

Catch

  • Revenue-based pricing scales with growth
  • Starts at $299 per month
  • Newer platform, limited track record
Pick it ifE-commerce media buyers and agencies needing accurate post-iOS14 attribution.
Skip it ifSmall stores wanting a free tier or B2B firms with long sales cycles.
PricingFrom $299/mo for stores under $50k revenue, scales with sales

Editor's takeAdBeacon scores highest in the category on data tracking accuracy, at 9.6 out of 10, using first-party store data instead of third-party cookies. Its Meta-styled interface and 24/5 live chat support media buyers switching from Facebook Ads Manager. The catch is revenue-based pricing, which starts at $299 a month and climbs as a store's sales grow.

How much does AdBeacon cost?

Standard pricing is revenue-based, starting at $299 per month for stores earning under $50,000 monthly, rising to $899 per month for $500k-$700k in revenue, according to SMB Guide's review.

How does AdBeacon track ad performance without cookies?

AdBeacon uses first-party data pulled directly from a store's Shopify, WooCommerce, or BigCommerce backend, plus a feature called Tether that captures events server-side, bypassing ad blockers and iOS privacy limits.

The evidence: 6 criteria, 2 penalties
9.2
Product Capability & DepthLooked for: Comprehensive multi-touch attribution features, audience building, and creative analytics tailored for e-commerce marketers.AdBeacon offers a robust suite of tools including first-party data tracking, real-time dashboards, an audience builder with RFM analysis, and a creative performance dashboard. It bypasses third-party cookie restrictions by using pixel-based, click-based attribution and proprietary models like Lighthouse to connect ad touchpoints directly to revenue.discovermybusiness.coadbeacon.tenereteam.com
9.6
Market Credibility & Trust SignalsLooked for: Positive user reviews, trusted industry partnerships, and a proven track record of reliable data tracking.The platform is highly rated by SMB Guide (8.6/10) and has positive aggregated reviews (4.5/5 on Tenere). Users praise its accuracy and agency-focused design. However, as a relatively newer software, it lacks the decades-long track record of legacy enterprise competitors, which is noted by some reviewers.smbguide.comadbeacon.tenereteam.com
9.0
Usability & Customer ExperienceLooked for: An intuitive user interface, easy onboarding, and responsive customer support for media buyers and agencies.AdBeacon features a familiar interface modeled after Meta's ad manager, ensuring media buyers can transition easily. The platform offers white-glove onboarding, live strategy sessions, and strong customer support including 24/5 live chat and Zoom consultations.g2.comadbeacon.tenereteam.com
8.5
Value, Pricing & TransparencyLooked for: Clear, accessible pricing tiers with good ROI potential for growing e-commerce businesses.AdBeacon's standard pricing is revenue-based, starting at $299/mo for up to $50k in revenue and scaling to $899/mo for $500k-$700k. They also offer fixed-price Annual Scaling and Agency plans. While transparent, the revenue-based scaling can make it expensive for smaller operations, though a 30-day free trial is available.smbguide.comadbeacon.com
9.5
Integrations & Ecosystem StrengthLooked for: Seamless native integrations with major e-commerce platforms and global ad networks.The platform boasts deep integrations with top e-commerce ecosystems like Shopify, WooCommerce, and BigCommerce. It also pulls in real-time data from major ad networks including Meta (Facebook/Instagram), Google Ads, Amazon Ads, TikTok, and Pinterest to provide unified reporting.discovermybusiness.coadbeacon.com
9.6
Data Tracking & Attribution AccuracyLooked for: Reliable, privacy-compliant tracking mechanisms that solve iOS14 data loss and cookie blocking.AdBeacon excels by utilizing first-party e-commerce data rather than relying on third-party cookies. Features like AdBeacon Tether capture real-time server-side events, keeping attribution windows open beyond traditional limits and neutralizing the impact of ad blockers and iOS privacy changes.adbeacon.comadbeacon.com

Score adjustments−0.08 points in total

−0.04Revenue-dependent pricing model means software costs automatically increase as the business grows, creating a high barrier for small operations.smbguide.com · severity 55/100
−0.04Noted by reviewers as a newer software with a limited track record compared to more established enterprise competitors.adbeacon.tenereteam.com · severity 40/100
6

Measured

measured.com · Measured Cross-Channel Dashboard #3 of 8 in Cross Channel Marketing Analytics Dashboards

Measured triangulates ad impact, skips mobile app tracking

Best forMid-market to enterprise DTC brands scaling ad investments across channels.

Quote only incrementality testingprivacy-firstenterprise
#3 in its ranking

Cross-channel dashboard triangulating media mix modeling and incrementality testing for causal marketing insight.

Standout factVoted #1 Measurement/Analytics technology by AdExchanger g2.com
Biggest catchLacks integrations with key mobile measurement partners like Adjust or Branch. incrementalityplatforms.com
#1 Measurement/Analytics tech, AdExchangerIndustry recognitiong2.com
300+Data integrationsmeasured.com

Standout number

300+fully-managed data integrations

Source: measured.com

In their words

“Measured triangulates signals from testing, modeling, and platform data to deliver a single, causal view of media impact across every channel.”

measured.com

Upside

  • Triangulates MMM, incrementality and attribution
  • 300-plus fully-managed data integrations
  • Privacy-first, cookie-independent methodology

Catch

  • Weak mobile app measurement support
  • High cost barrier for small businesses
  • No public pricing available
Pick it ifMid-market to enterprise DTC brands scaling ad investments across channels.
Skip it ifSmall businesses or brands seeking standard multi-touch attribution tools.
PricingCustom quote, enterprise-focused pricing

Editor's takeMeasured triangulates media mix modeling with incrementality testing rather than leaning on flawed multi-touch attribution, a design built for a privacy-first, post-iOS 14.5 world. AdExchanger voted it the top measurement and analytics technology, and it connects to more than 300 managed data sources. It fits mid-market and enterprise DTC brands better than mobile-first apps, since it lacks integrations with key mobile measurement partners like Adjust or Branch.

How does Measured calculate marketing impact?

It triangulates signals from testing, modeling and platform data to deliver a single causal view of media impact, rather than relying on cookie-based attribution.

Is Measured good for mobile app marketing?

Not especially. Independent reviews note it lacks integrations with key Mobile Measurement Partners like Adjust or Branch, unlike mobile-focused competitors.

7

Amplitude

amplitude.com · Amplitude B2B SaaS Analytics #1 of 6 in Marketing Analytics Tools for B2B SaaS Companies

Amplitude adds account-level analytics built for B2B SaaS

Best forEnterprise B2B SaaS teams analyzing account health and complex user journeys.

Free tier From $49 per month free planSOC 2HIPAA
Top of its ranking

Analytics platform with a dedicated Accounts feature for tracking B2B company-level behavior.

Standout factThe free Starter plan includes 10,000 monthly tracked users and up to 10 million events. amplitude.com
Biggest catchSession replay works on web only, with no support for mobile apps. uxcam.com
10,000Free plan MTU limitamplitude.com
130+Integrationsamplitude.com
$49/moPlus plan starting priceamplitude.com

Standout number

130+integrations for B2B SaaS data

Source: amplitude.com

The thing people get wrong

Amplitude session replay works everywhere the SDK does

Session replay is limited to web applications and does not support mobile apps

Source: uxcam.com

Upside

  • Account-level analytics for B2B teams
  • Free plan covers 10,000 monthly users
  • 130+ integrations including Salesforce

Catch

  • Session replay limited to web apps
  • Pricing scales sharply with growth
  • Steep learning curve for beginners
Pick it ifEnterprise B2B SaaS teams analyzing account health and complex user journeys.
Skip it ifEarly-stage startups on tight budgets due to cost scaling.
PricingFree up to 10,000 MTUs, Plus plan from $49/mo

Editor's takeAmplitude's Accounts add-on tracks company-level behavior instead of just individual users, answering a question generic analytics tools miss. It backs that with SOC 2 Type II certification and an EU data center in Frankfurt for GDPR needs. The catch is session replay, which only works on web apps and leaves mobile-first B2B products without that view.

Does Amplitude track B2B accounts, not just users?

Yes. The Accounts add-on tracks account health, onboarding speed, and product qualified leads at the company level, a feature built specifically for B2B SaaS teams.

Does Amplitude offer EU data residency?

Yes. Amplitude operates a data center in Frankfurt, Germany, to support GDPR requirements alongside its SOC 2 Type II and ISO 27001 certifications.

The evidence: 6 criteria, 3 penalties
9.4
Product Capability & DepthLooked for: We evaluate the breadth of analytics features specifically designed for B2B SaaS, such as account-level tracking, retention analysis, and cross-platform monitoring.Amplitude offers a dedicated 'Accounts' add-on specifically for B2B contexts, allowing teams to analyze behavior at the organization level rather than just the user level. The platform includes advanced behavioral cohorts, funnel analysis, and a web-only session replay feature.amplitude.comuxcam.comuserpilot.medium.com
9.3
Market Credibility & Trust SignalsLooked for: We assess the vendor's market standing, public status, and adoption by enterprise-tier clients in the SaaS industry.Amplitude is a publicly traded company (NASDAQ: AMPL) trusted by major enterprises like Atlassian, Dropbox, and Zoom. It is widely recognized as a leader in digital analytics with high user ratings across review platforms.appmarketplace.comg2.com
8.6
Usability & Customer ExperienceLooked for: We examine the ease of use for non-technical teams, the learning curve, and the quality of customer support resources.While powerful, the platform is consistently cited as having a steep learning curve that can overwhelm non-technical users. Support quality is reported to be slower for lower-tier plans, though the knowledge base is extensive.userpilot.medium.comg2.com
8.5
Value, Pricing & TransparencyLooked for: We analyze the pricing structure, transparency of costs, and the value provided at different tiers, especially for growing SaaS companies.Amplitude offers a generous free 'Starter' plan with 10K MTUs, but pricing for 'Growth' and 'Enterprise' plans is not public. Costs can scale rapidly as Monthly Tracked Users (MTUs) increase, creating potential budget shocks.amplitude.comamplitude.comlivesession.io
9.6
Security, Compliance & Data ProtectionLooked for: We verify certifications and compliance standards critical for B2B SaaS, such as SOC 2, GDPR, and HIPAA.Amplitude maintains a robust security posture with SOC 2 Type II and ISO 27001 certifications. It is HIPAA compliant (with BAA) and offers data residency options in the US and EU (Frankfurt) to satisfy GDPR requirements.amplitude.comamplitude.com
9.1
Integrations & Ecosystem StrengthLooked for: We evaluate the availability and quality of integrations with common B2B SaaS tools like CRMs, CDPs, and marketing platforms.The platform boasts over 130 integrations, including deep connections with Salesforce, HubSpot, and Segment. It supports bidirectional data syncs, allowing cohorts to be exported back to marketing tools for activation.amplitude.comamplitude.com

Score adjustments−0.16 points in total

−0.08Session Replay functionality is currently limited to web applications and does not support mobile apps, a significant gap for mobile-first B2B products.uxcam.com · severity 60/100
−0.05The platform has a documented steep learning curve, with users reporting it can be overwhelming for non-technical team members compared to simpler alternatives.userpilot.medium.com · severity 50/100
−0.03Pricing scales rapidly with Monthly Tracked Users (MTUs), and the lack of public pricing for Growth/Enterprise plans can lead to budget uncertainty.livesession.io · severity 45/100
8

Mouseflow

mouseflow.com · Mouseflow Behavior Analytics #2 of 6 in Marketing Analytics Tools for B2B SaaS Companies

Mouseflow scores frustration automatically, but data retention stays short

Best forUX and marketing teams needing heatmaps and session replay for SaaS.

Free tier From $31 per month HIPAASOC 2ISO 27001
#2 in its ranking

Mouseflow tracks user behavior with heatmaps, session replay, and a Friction Score.

Standout factMouseflow's Friction Score automatically quantifies frustration events like click-rage. mouseflow.com
Biggest catchLower-tier plans limit data retention to about 1 to 3 months. g2.com
210,000+Clients worldwidemouseflow.com
6Heatmap typesmouseflow.com
$31/moStarting pricesaasworthy.com

By the numbers

6heatmap types
210k+clients worldwide
50+integrations

Source: mouseflow.com

Compliance

✓ SOC 2 Type II✓ ISO 27001✓ HIPAA

Source: mouseflow.com

Upside

  • Six auto-generated heatmap types
  • Proprietary Friction Score for UX issues
  • ISO 27001, SOC 2, HIPAA compliant

Catch

  • Data retention limited on lower plans
  • Interface can feel dated
  • Lags on very large datasets
Pick it ifUX and marketing teams needing heatmaps and session replay for SaaS.
Skip it ifTeams needing deep event-based analytics or revenue attribution.
PricingFrom $31/mo, with a free plan for limited features

Editor's takeMouseflow pairs six heatmap types with a proprietary Friction Score that flags frustration events like click-rage automatically. It combines SOC 2, ISO 27001, and HIPAA compliance, rare in this category. Reviewers note the interface can feel dated and slows down on large datasets.

Is Mouseflow HIPAA compliant?

Yes, for its US data center. Mouseflow provides Business Associate Agreements for Enterprise customers, alongside SOC 2 Type II and ISO 27001 certification.

What is Mouseflow's Friction Score?

It is a proprietary metric that quantifies user frustration by counting events like click-errors, click-rage, and bounces. Teams can spot UX problems without watching every session recording.

The evidence: 6 criteria, 3 penalties
9.1
Product Capability & DepthLooked for: We evaluate the breadth of analytics tools, including heatmap varieties, session recording fidelity, and advanced features like friction detection.Mouseflow offers six distinct heatmap types (click, scroll, attention, movement, geo, live) and a proprietary 'Friction Score' that automatically detects user frustration points like click-rage.mouseflow.commouseflow.com
9.3
Market Credibility & Trust SignalsLooked for: We assess the vendor's industry standing, customer base size, and adoption by reputable enterprise organizations.The platform is trusted by over 210,000 clients worldwide, including major enterprise brands, and maintains high-level compliance certifications.mouseflow.commouseflow.com
8.7
Usability & Customer ExperienceLooked for: We examine the ease of installation, interface intuitiveness, and the quality of user support resources.Setup is rapid (often under a minute), though some users report the interface can feel dated or become slow when processing large datasets.top10best-website-session-replay.comconversiongems.com
8.9
Value, Pricing & TransparencyLooked for: We analyze pricing structures, free tier availability, and the feature-to-cost ratio compared to market alternatives.Offers a robust free plan and competitive paid tiers starting around $31/month, providing significant value with features often gated by competitors.saasworthy.comhotjar.com
9.6
Security, Compliance & Data ProtectionLooked for: We verify adherence to strict data privacy standards, encryption protocols, and industry-specific compliance requirements.Mouseflow demonstrates best-in-class security with SOC 2 Type II, ISO 27001, GDPR, CCPA, and HIPAA compliance (US data center).mouseflow.commouseflow.com
8.8
Integrations & Ecosystem StrengthLooked for: We evaluate the library of native integrations with CMS, analytics, marketing, and e-commerce platforms.The platform supports over 50 native integrations including major players like Google Analytics 4, Adobe Analytics, HubSpot, and Shopify.mouseflow.commouseflow.com

Score adjustments−0.13 points in total

−0.05Users have reported performance lags and slow loading times when processing large datasets or viewing complex session recordings.g2.com · severity 50/100
−0.03Data retention is limited on lower-tier plans (typically 1 to 3 months), forcing upgrades for longer historical analysis.g2.com · severity 45/100
−0.05Some users describe the user interface as 'dated' compared to newer, more modern competitors in the space.conversiongems.com · severity 40/100
9

Supermetrics

supermetrics.com · Supermetrics B2B SaaS Marketing #3 of 6 in Marketing Analytics Tools for B2B SaaS Companies

Supermetrics processes 15% of global ad spend, from €29/month

Best forMarketers automating data pulls into Sheets, Excel or BI tools

From $29 per month SOC 2no-codeBI integration
#3 in its ranking

No-code connector pulling marketing data from 100+ platforms into Sheets, Looker Studio and warehouses.

Standout factSupermetrics processes about 15% of global ad spend supermetrics.com
Biggest catchUsers report 40-60% price increases overnight at contract renewal. dataslayer.ai
~15%Global ad spend processedsupermetrics.com
200,000+Organizations using Supermetricssupermetrics.com
€29/moStarting pricedataslayer.ai

Standout number

15%of global ad spend processed through Supermetrics

Source: supermetrics.com

What changed

40-60%reported price increase at contract renewal

Source: dataslayer.ai

Upside

  • 100+ data source connectors
  • Trusted by 200,000+ organizations worldwide
  • SOC 2 Type II compliant

Catch

  • Price can jump 40-60% at renewal
  • Costs escalate with sources and seats
  • Interface complex for some users
Pick it ifMarketers automating data pulls into Sheets, Excel or BI tools
Skip it ifTeams needing built-in attribution modeling without external BI tools
PricingFrom €29/month, escalates with data sources and user seats

Editor's takeSupermetrics' scale claim, 15% of global ad spend flowing through its connectors, is a specific number that explains why it is the default choice for agencies. Its 100-plus connector library backs that up. The pricing model is the real friction point, with users on record describing 40 to 60 percent increases at renewal with no new features added.

How much does Supermetrics cost?

Plans start around €29 a month, but pricing scales with the number of data sources, destinations and user seats, and some users report steep renewal increases.

How many data sources does Supermetrics connect to?

Over 100, including LinkedIn Ads, HubSpot, Google Analytics and Salesforce, feeding into Google Sheets, Looker Studio, Power BI or a data warehouse.

The evidence: 6 criteria, 3 penalties
9.3
Product Capability & DepthLooked for: We evaluate the tool's ability to automate complex B2B data pipelines, blend data from distinct marketing channels, and support granular reporting needs without coding.Supermetrics offers a robust no-code platform connecting over 100 marketing and sales tools, including critical B2B sources like LinkedIn Ads and HubSpot, directly into destinations like Google Sheets, Looker Studio, and BigQuery.supermetrics.comyoutube.comsupermetrics.com
9.4
Market Credibility & Trust SignalsLooked for: We assess the vendor's market presence, adoption by major enterprises, and verified reputation within the B2B SaaS industry.Supermetrics is a dominant market leader trusted by over 200,000 organizations globally, processing approximately 15% of global ad spend, with high-profile clients like Nestlé and Dyson.supermetrics.comsupermetrics.comtrustpilot.com
8.8
Usability & Customer ExperienceLooked for: We look for ease of setup, interface intuitiveness for non-technical marketers, and the quality of support resources available.Users generally praise the no-code interface and ease of setup, though some report the UI can be complex and support response times vary for lower-tier plans.g2.comg2.comcommunity.supermetrics.com
8.2
Value, Pricing & TransparencyLooked for: We evaluate the pricing model's clarity, scalability, and total cost of ownership relative to the features provided for B2B SaaS teams.While powerful, the pricing model is a frequent point of friction, with costs escalating rapidly based on the number of users, data sources, and destinations.dataslayer.aidataslayer.aireportingninja.com
9.6
Integrations & Ecosystem StrengthLooked for: We examine the breadth of B2B-specific connectors and the depth of integration with major BI and warehousing destinations.Supermetrics excels here with over 100 connectors covering virtually all major B2B marketing platforms and seamless integration with Google Sheets, Looker, and data warehouses.supermetrics.comyoutube.comwindsor.ai
9.5
Security, Compliance & Data ProtectionLooked for: We verify adherence to enterprise-grade security standards like SOC 2, GDPR, and encryption protocols essential for handling sensitive B2B data.The platform maintains rigorous security standards including SOC 2 Type II compliance, GDPR adherence, and encryption for data at rest and in transit.supermetrics.comsupermetrics.comsupermetrics.com

Score adjustments−0.18 points in total

−0.05Users report significant cost escalation due to add-on fees for additional users, data sources, and destinations, making budgeting difficult.dataslayer.ai · severity 75/100
−0.08Some users experience occasional connector breakages or instability, which can disrupt automated reporting workflows.dataslayer.ai · severity 60/100
−0.05Customer support response times can be slow for lower-tier plans, with some users expressing frustration over reliance on chat interfaces.trustpilot.com · severity 50/100
10

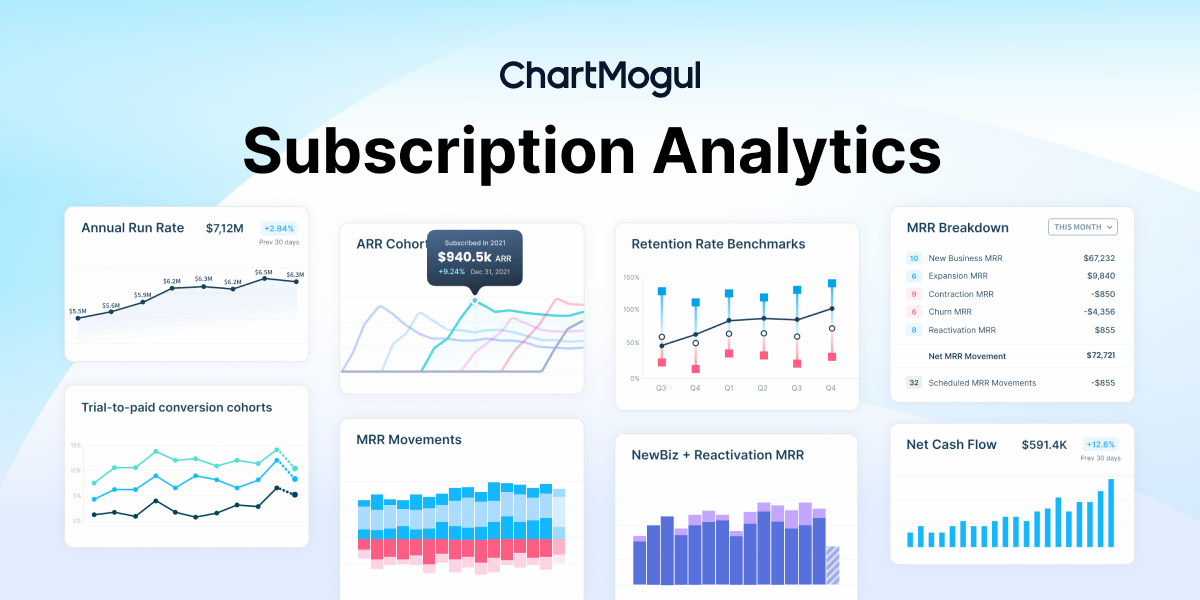
ChartMogul

chartmogul.com · ChartMogul Subscription Analytics #2 of 7 in Analytics Tools for Subscription and Recurring Revenue Brands

ChartMogul is free until $10,000 in monthly revenue

Best forEarly-stage SaaS founders wanting standard metrics without spreadsheets

Free tier From $100 per month SOC 2GDPRfree plan
#2 in its ranking

A subscription analytics platform that cleans billing data into audit-ready SaaS metrics.

Standout factThe Scale plan starts at $100 a month and includes the first $10,000 of monthly recurring revenue. chartmogul.com
Biggest catchChartMogul lacks built-in automated dunning or revenue recovery tools, so it often needs pairing with another tool. baremetrics.com
$10,000 MRRFree plan ceilingchartmogul.com
2,500+SaaS customerschartmogul.com
$100/moScale plan starting priceg2.com

Free vs paid

Launch plan

$0
  • Under $10k MRR
  • Core SaaS metrics

Scale plan from

$100/mo
  • +$25/mo per $10k MRR tier
  • Data cleaning tools

Source: chartmogul.com

Connects to

StripeBraintreeRecurlyChargebeeSnowflakenative billing + warehouse exports total

Source: chartmogul.com

Upside

  • Free for startups under $10k MRR
  • SOC 2 Type II certified
  • Merges and cleans billing data

Catch

  • No built-in dunning tools
  • Data syncs need manual fixes
  • Costs scale up with revenue
Pick it ifEarly-stage SaaS founders wanting standard metrics without spreadsheets
Skip it ifBusinesses wanting billing and analytics in one tool
PricingFree under $10k MRR, Scale plan from $100/mo after that

Editor's takeChartMogul stands out for data cleaning tools that fix billing sync errors other analytics tools ignore. Trusted by 2,500+ SaaS companies, it still leaves revenue recovery to a separate tool.

Is ChartMogul free?

Yes, for SaaS companies under $10,000 in monthly recurring revenue. The paid Scale plan starts at $100 a month above that threshold.

Does ChartMogul handle failed payment recovery?

No. It lacks built-in automated dunning or revenue recovery tools, so it is often paired with a separate billing tool for that.

The evidence: 6 criteria, 2 penalties
8.8
Product Capability & DepthLooked for: We evaluate the breadth of subscription metrics (MRR, LTV, Churn), segmentation capabilities, and data accuracy tools available for SaaS businesses.ChartMogul offers comprehensive subscription analytics including MRR, ARR, churn, and cohort analysis, distinguished by unique data cleaning features that allow users to merge customers and edit MRR manually.chartmogul.comchartmogul.complgdemos.com
9.4
Market Credibility & Trust SignalsLooked for: We assess the product's adoption rate, customer base quality, and industry reputation among SaaS companies.The platform is widely trusted by over 2,500 SaaS businesses, including notable companies like Buffer and Pitch, and maintains a strong reputation for data reliability.chartmogul.comchartmogul.com
8.7
Usability & Customer ExperienceLooked for: We examine user interface design, ease of setup, and the quality of customer support resources.Users praise the clean visualizations and dashboard utility, though some report friction with initial data synchronization discrepancies that require manual reconciliation.chartmogul.comg2.comhelp.chartmogul.com
8.9
Value, Pricing & TransparencyLooked for: We evaluate pricing transparency, the generosity of free tiers, and cost scalability for growing businesses.Pricing is fully transparent with a generous free plan for startups under $10k MRR, though costs increase based on revenue tiers which can become significant for scaling companies.chartmogul.comchartmogul.comg2.com
9.2
Integrations & Ecosystem StrengthLooked for: We look for the breadth of native integrations with billing gateways, CRMs, and data warehousing solutions.ChartMogul boasts an extensive library of native integrations with major billing providers (Stripe, Braintree, Recurly) and data export options to warehouses like Snowflake.chartmogul.comchartmogul.comchartmogul.com
9.5
Security, Compliance & Data ProtectionLooked for: We verify security certifications, data encryption standards, and compliance with regulations like GDPR and SOC 2.The platform adheres to the highest industry standards, being SOC 2 Type II certified and GDPR compliant, with strict data access controls.chartmogul.comchartmogul.comchartmogul.com

Score adjustments−0.13 points in total

−0.06Users frequently report data discrepancies between ChartMogul and billing sources like Stripe, necessitating manual data cleaning and reconciliation efforts.reddit.com · severity 55/100
−0.07ChartMogul lacks built-in automated dunning and revenue recovery tools (e.g., automated emails for failed payments), which are standard in some direct competitors.baremetrics.com · severity 50/100
02

Every ranking in Marketing Attribution & Analytics Platforms

Each card shows the top three. The eye opens a quick look. Open a ranking for every product, the evidence and the comparison table.

1 RecurlyRecurly recovered $794M in revenue, but charges 1.25% per transaction 9.1/10
Visit ↗
2 ChartMogulChartMogul is free until $10,000 in monthly revenue 8.9/10
Visit ↗
3 Easy SubscriptionsEasy Subscriptions charges 0% transaction fees on every plan 8.9/10
Visit ↗
See all 7 ranked
1 AdBeaconFirst-party tracking beats iOS14 loss, but price scales with revenue. 9.1/10
Visit ↗
2 AttribulyDe-anonymizes 45% of visitors, credit pricing confuses users 9.0/10
Visit ↗
3 MeasuredMeasured triangulates ad impact, skips mobile app tracking 9.0/10
Visit ↗
See all 8 ranked
1 ZeroBounceZeroBounce tracks opens for a year, now forces bundles. 9.2/10
Visit ↗
2 AttribulyAttribuly unmasks anonymous shoppers, but credits burn fast. 9.2/10
Visit ↗
3 Market Tracker 360Market Tracker 360 costs $500/mo, excluded from all plans 9.2/10
Visit ↗
See all 14 ranked
1 AmplitudeAmplitude adds account-level analytics built for B2B SaaS 9.0/10
Visit ↗
2 MouseflowMouseflow scores frustration automatically, but data retention stays short 9.0/10
Visit ↗
3 SupermetricsSupermetrics processes 15% of global ad spend, from €29/month 9.0/10
Visit ↗
See all 6 ranked
03

About Marketing Attribution & Analytics Platforms

What the category is, how it developed, and what to look for. Two minutes, or the long read.

Marketing Attribution & Analytics Platforms are sophisticated software solutions designed to quantify the influence of specific marketing touchpoints on business outcomes, such as lead generation, sales opportunities, and revenue. This category covers software used to measure and assign credit to marketing interactions across the full customer acquisition lifecycle: tracking user behavior across channels (online and offline), modeling conversion paths, calculating return on ad spend (ROAS), and optimizing budget allocation based on performance data. It sits between Web Analytics (which focuses on site-level behavior and traffic) and Business Intelligence (BI) (which focuses on broader organizational data visualization). It includes both general-purpose cross-channel measurement solutions and vertical-specific platforms built for complex sectors like B2B SaaS or mobile commerce.

Read the full category guide

WHAT IS MARKETING ATTRIBUTION & ANALYTICS PLATFORMS?

The core problem these platforms solve is the "black box" of marketing performance. In a fragmented media landscape where a single customer may interact with a brand via social media, paid search, email, and connected TV before converting, traditional "last-click" measurement is insufficient. These platforms ingest data from ad networks, CRMs, and site pixels to create a unified view of the customer journey. They utilize deterministic matching (linking known user IDs) and probabilistic modeling (using machine learning to estimate connections) to answer the fundamental question: "Which half of my marketing budget is wasted?"

Usage extends beyond the marketing department. While performance marketers use these tools for daily bid optimization, Finance teams rely on them for verifying Customer Acquisition Costs (CAC), and Sales leaders use the data to understand lead quality and pipeline velocity. For enterprise teams, these platforms serve as the single source of truth for media efficacy, replacing disjointed spreadsheets and platform-specific reports that often inflate performance numbers due to double-counting.

HISTORY

The evolution of Marketing Attribution & Analytics Platforms mirrors the increasing complexity of the internet itself. In the late 1990s and early 2000s, measurement was largely confined to server logs and basic hit counters. The launch of web analytics giants in the mid-2000s standardized the "session" as the primary unit of measurement. During this era, the "last-click" model reigned supreme because the user journey was relatively linear: a user searched, clicked, and bought. Attribution was a feature of web analytics, not a standalone software category. The gap that created this specific category emerged with the explosion of programmatic advertising and the proliferation of mobile devices in the late 2000s.

By the early 2010s, marketers faced a crisis of fragmentation. A user might see a display ad on a desktop, research on a mobile device, and convert via a direct type-in days later. CRM systems tracked the close, and ad platforms tracked the click, but nothing connected the two. This gap birthed the first wave of dedicated Multi-Touch Attribution (MTA) vendors. These early vertical SaaS providers promised to track every single touchpoint, giving rise to algorithmic models that moved beyond arbitrary rules like "first-touch" or "time-decay." This period saw significant market consolidation, as major marketing clouds acquired independent attribution pioneers to bolster their suites.

However, the narrative shifted dramatically around 2018-2020. The introduction of GDPR in Europe and CCPA in California, followed by major browser privacy updates (like Intelligent Tracking Prevention) and mobile operating system changes (App Tracking Transparency), shattered the deterministic tracking model. The "golden age" of tracking individual users across the entire web ended. This forced a massive pivot in the category [1]. Buyer expectations evolved from "give me a database of every user interaction" to "give me actionable intelligence despite signal loss." Today, the market is defined by "Unified Marketing Measurement" (UMM), which blends the granular tracking of MTA with the aggregate statistical methods of Marketing Mix Modeling (MMM) to provide insights that respect privacy while delivering strategic value [2].

WHAT TO LOOK FOR

Evaluating Marketing Attribution & Analytics Platforms requires a skeptical eye, as the market is filled with "black box" solutions that promise AI-driven magic without explaining the methodology. The most critical evaluation criterion is Identity Resolution and Graph Quality. You must ask how the vendor identifies users across devices and browsers without third-party cookies. Do they rely on a proprietary device graph? Do they use fingerprinting (which is increasingly blocked)? Or do they rely on first-party data integrations? A platform that cannot articulate its identity resolution strategy in a post-cookie world is a liability.

A major red flag is a vendor that claims 100% accuracy. In the current privacy landscape, perfect deterministic attribution is impossible. Honest vendors will discuss "modeled conversions" and "statistical significance" rather than claiming to track every single penny perfectly. Another warning sign is a lack of Walled Garden visibility. Google, Meta (Facebook/Instagram), and Amazon are notoriously protective of their data. If a platform claims to have perfect insight into impression-level data inside these gardens without a certified partnership or API integration, they are likely overpromising or scraping data in non-compliant ways.

Key questions to ask vendors include: "How does your model handle view-through conversions versus click-through conversions?" View-through (credit for seeing an ad without clicking) is notoriously difficult to measure and easy to manipulate to inflate ROI. Ask for their specific methodology on "incrementality"—how do they prove the ad caused the sale, rather than just correlating with it? Furthermore, inquire about Data Portability. Can you export the raw event-level data to your own data warehouse (like Snowflake or BigQuery), or is the data locked inside their dashboard? The ability to own your attribution data is critical for long-term analysis and avoiding vendor lock-in.

INDUSTRY-SPECIFIC USE CASES

Retail & E-commerce

For Retail and E-commerce brands, the primary driver for attribution is Return on Ad Spend (ROAS) at the SKU or category level. Unlike B2B, transaction volumes are high, and sales cycles are relatively short (minutes to days). The specific need here is granular, impression-level tracking that can handle high-velocity data and attribute revenue to dynamic creative elements (e.g., which color of the shoe in the ad drove the sale?). Evaluation priorities focus heavily on integrations with shopping cart platforms (Shopify, Magento, BigCommerce) and inventory management systems. A unique consideration is the treatment of marketplaces; brands need to know if a sale occurred on their Direct-to-Consumer (DTC) site or via Amazon, as the margin implications are drastically different. They also heavily utilize probabilistic modeling to account for cross-device behavior, such as browsing on mobile but purchasing on desktop [3].

Healthcare

Healthcare marketing attribution operates under the strictest constraints due to HIPAA in the US and GDPR in Europe. The unique consideration here is Privacy-First Measurement. Healthcare marketers cannot use standard tracking pixels that might leak Protected Health Information (PHI) to ad networks (e.g., retargeting a user based on a "cancer treatment" page visit is a major violation). Evaluation priorities shift from granularity to compliance; vendors must sign Business Associate Agreements (BAAs) and utilize clean rooms or aggregate measurement methods. The specific need is to attribute patient acquisition costs without ever exposing individual patient identities. This often means relying heavily on call tracking attribution (for appointment booking) and Marketing Mix Modeling (MMM) rather than user-level multi-touch attribution [4].

Financial Services

Financial Services (banking, insurance, wealth management) face a "long cycle, high value" challenge combined with regulatory compliance (e.g., Fair Lending laws). The customer journey for a mortgage or life insurance policy can take months and involve both digital research and offline branch visits or agent phone calls. A unique consideration is Offline-to-Online Reconciliation. These institutions need platforms that can ingest secure offline conversion files (e.g., a loan being funded) and match them back to anonymous digital identifiers from months prior. Evaluation priorities include enterprise-grade security certifications (SOC 2 Type II, ISO 27001) and the ability to audit the algorithmic models to ensure they aren't inadvertently targeting or excluding protected demographics in violation of compliance standards [5].

Manufacturing

Manufacturing marketing is often characterized by a B2B2C (Business to Business to Consumer) model, where the manufacturer markets to the end-user but sells through a dealer or distributor network. The specific need is attributing brand advertising (TV, Digital Display) to sales that happen in third-party retail locations where the manufacturer has no Point of Sale (POS) visibility. Evaluation priorities focus on "warranties and registrations" attribution—matching post-sale warranty registrations back to pre-sale media exposure. Unique considerations involve "channel conflict" and sharing data with dealer networks. Manufacturers often require platforms that can ingest unstructured data from disparate dealer systems to form a cohesive picture of demand generation [6].

Professional Services

For Professional Services (law firms, consultancies, agencies), the "product" is expertise, and the sales cycle is relationship-driven and non-linear. The volume of conversions is low, but the value is extremely high. Specific needs revolve around Account-Based Attribution rather than lead-based attribution. They need to know if *anyone* from a target client company visited the website, read a whitepaper, or attended a webinar, even if they didn't fill out a form. Evaluation priorities include deep integration with CRM platforms (Salesforce, HubSpot) to track "soft" touchpoints like email opens and LinkedIn engagement. A unique consideration is the heavy reliance on "dark social" (peer-to-peer sharing via email/Slack), which is notoriously hard to track but critical in this sector [7].

SUBCATEGORY OVERVIEW

Cross Channel Marketing Analytics Dashboards

This subcategory serves as the central command center for generalist marketing teams. What makes these tools genuinely different is their focus on data visualization and aggregation rather than deep algorithmic modeling. Unlike specialized attribution tools that might run complex machine learning to assign fractional credit, dashboard tools prioritize the breadth of connections—pulling API data from Facebook, Google, LinkedIn, TikTok, and SEO tools into a single pane of glass. The specific workflow that ONLY these tools handle well is the "Monday Morning Report"—automating the consolidation of disparate spend and performance metrics into a client-facing or executive-facing presentation. The pain point driving buyers here is "Excel Hell"—the manual labor of copying and pasting data from ten different login screens. For teams needing a unified view without the complexity of data science, our guide to Cross Channel Marketing Analytics Dashboards offers a detailed breakdown of the best visualization-focused platforms.

Analytics Tools for Subscription and Recurring Revenue Brands

This niche differs from generic platforms by shifting the primary metric from "Acquisition" to "Lifetime Value" (LTV) and "Churn." A generic attribution tool stops caring once the conversion happens. However, for a subscription box or SaaS tool, the first transaction is just the beginning. These specialized tools handle Cohort Analysis and Revenue Recognition workflows that general tools cannot touch. They answer questions like, "Do customers acquired via Facebook Ads churn faster than those acquired via SEO?" rather than just "How much did it cost to acquire them?" The specific pain point driving buyers here is the "leaky bucket"—spending money to acquire customers who cancel after one month, which looks like success in a standard tool but is a failure in a subscription model. To explore tools that understand MRR (Monthly Recurring Revenue) movements, see our guide to Analytics Tools for Subscription and Recurring Revenue Brands.

Marketing Analytics Tools for B2B SaaS Companies

The defining characteristic of this subcategory is the shift from "Individual" measurement to "Account" measurement. In B2B SaaS, a junior employee might research a tool, a manager might demo it, and a VP might sign the contract. Generic tools see this as three separate people; specialized B2B tools recognize this as one "Buying Committee" or Account. The workflow that ONLY these tools handle well is Pipeline Attribution—connecting top-of-funnel marketing touches (like reading a blog) to bottom-of-funnel sales activities (like a closed-won opportunity in Salesforce) months later. The pain point driving buyers here is the "Sales-Marketing Divide," where Marketing claims they sent leads, but Sales claims the leads were junk. These platforms provide the indisputable evidence of which campaigns influenced revenue. For deep dives into account-based measurement, refer to Marketing Analytics Tools for B2B SaaS Companies.

Marketing Analytics Platforms for Ecommerce Brands

These platforms are distinct because they integrate deeply with inventory and Cost of Goods Sold (COGS) data. While a generic tool tracks "Revenue," an ecommerce-specific platform tracks "Contribution Margin"—revenue minus ad spend, shipping, transaction fees, and product cost. The unique workflow they enable is Profit-Based Bidding. Instead of optimizing ads for the highest revenue (which might be low-margin products), these tools help marketers bid on products that actually drive bottom-line profit. The pain point driving buyers here is "Empty Calories"—scaling revenue while bleeding profit due to hidden costs that standard analytics tools ignore. For brands that need to optimize for net profit rather than just gross revenue, check out our guide to Marketing Analytics Platforms for Ecommerce Brands.

Integration & API Ecosystem

The efficacy of any attribution platform is capped by the quality of its integrations. It is not enough for a vendor to claim they "integrate with Salesforce"; the depth and directionality of that integration matter. A robust API ecosystem must handle Data Normalization—the grueling process of making sure "Campaign A" in Google Ads matches "Campaign_A" in your internal database. Inconsistent naming conventions can render analytics useless.

According to Gartner, poor data quality costs organizations an average of $12.9 million annually [8]. This financial bleed often stems from integration failures where data is lost or corrupted during transfer. Gartner’s analysts note that "D&A leaders must take pragmatic and targeted actions to improve their enterprise data quality if they want to accelerate their organizations' digital transformation" [9].

Real-World Scenario: Consider a mid-sized professional services firm with 50 employees using HubSpot for marketing and a legacy ERP for invoicing. They purchase an attribution tool to measure ROI. The tool integrates with HubSpot via API but requires flat-file uploads for the ERP. When the firm tries to match a "Closed Won" deal in the ERP to a "Lead" in HubSpot, the integration breaks because the ERP uses "Client ID 123" and HubSpot uses email addresses. Without a common key (Identity Resolution) or a middleware integration that cleanses this data automatically, the attribution tool reports $0 revenue for the campaign. The firm ends up paying for a "dashboard" that is empty, requiring them to hire a data engineer to build a custom ETL (Extract, Transform, Load) pipeline, effectively doubling the implementation cost.

Security & Compliance

Security in marketing analytics is no longer just an IT concern; it is a C-suite liability. Platforms must be evaluated on their ability to handle Personally Identifiable Information (PII) without exposing the organization to regulatory fines. The critical standard is Data Residency—knowing exactly where your customer data is physically stored, especially for companies operating in the EU (GDPR) or California (CCPA).

The stakes are high. IBM's 2024 Cost of a Data Breach Report found that the global average cost of a data breach reached $4.88 million, a 10% increase from the previous year [10]. Forrester further emphasizes that "inadequate data protection severely impacts customer trust," creating long-term brand damage beyond immediate fines [11].

Real-World Scenario: A financial services company implements a marketing analytics pixel on their mortgage application page. The marketing team, eager to optimize for "completed applications," configures the tool to scrape form fields. Unknowingly, the tool captures the applicant's income and social security number in the URL parameters or metadata. This data is then sent to the analytics vendor's server, which is not configured for PHI/PII encryption standards required by financial regulations. During a routine audit, this leak is discovered. The company faces a massive compliance violation, not because of a hacker, but because the attribution tool's default configuration was not compliant with the industry's strict data governance standards. This highlights the necessity of "Privacy by Design" in vendor selection.

Pricing Models & TCO

Pricing for attribution software is notoriously opaque and complex. The most common model is Event-Based Pricing (or Monthly Tracked Users - MTU), where costs scale with the volume of traffic or interactions. However, Total Cost of Ownership (TCO) often balloons due to hidden fees for data retention, additional seats, or "premium" integrations. Buyers must calculate TCO based on future growth, not current volume.

Analysts warn that the "sticker price" is deceptive. As noted in industry analyses of TCO, operational costs—such as maintenance, upgrades, and support contracts—can vary significantly depending on complexity, often exceeding the license fee itself [12]. Amplitude suggests that implementation and ongoing maintenance often comprise a larger portion of the TCO than the software license [13].

Real-World Scenario: A fast-growing B2B SaaS company with a 25-person marketing team buys an attribution platform quoted at $30,000/year based on their current web traffic of 100,000 visitors/month. The contract includes a "Data Overage" fee of $0.01 per event. Six months later, the company launches a successful viral campaign and high-frequency product usage tracking. Their event volume spikes to 10 million events/month. The next invoice is not $2,500, but $102,500 due to overages. Furthermore, the platform charges per "seat" for analysis. As the team grows and 10 more analysts need access, the license fees jump another $20,000. The calculated TCO moves from a manageable $30k to a crippling $150k+, forcing the company to rip and replace the tool mid-year—a disastrous waste of resources.

Implementation & Change Management

The primary cause of failure for attribution projects is not technology, but Change Management. Implementing these platforms requires a rigid adherence to UTM taxonomy and tagging standards. If one agency uses "cpc" and another uses "paid_search," the attribution model breaks. Success requires a cultural shift where every marketer agrees to follow strict data entry protocols.

Gartner predicts that by 2027, 80% of data and analytics governance initiatives will fail due to a lack of a real or manufactured crisis that forces adherence [14]. Saul Judah, VP Analyst at Gartner, explicitly states that "A D&A governance program that does not enable prioritized business outcomes fails."

Real-World Scenario: A large retail conglomerate rolls out a new Multi-Touch Attribution platform. The technical implementation takes three months. However, the social media team continues to use their own "internal shorthand" for campaign tagging, while the email team uses a different automated tagging system. The attribution platform reports that "Direct Traffic" is driving 80% of revenue because it cannot recognize the malformed tags from social and email. The VP of Marketing declares the tool "broken" and the team reverts to last-click Google Analytics. The failure wasn't the software; it was the lack of a unified governance council to enforce tagging standards across the 50-person marketing department. The tool becomes shelfware.

Vendor Evaluation Criteria

When selecting a vendor, buyers must distinguish between "Glass Box" (transparent) and "Black Box" (opaque) methodologies. A Glass Box vendor allows you to see the weighting logic (e.g., "we give 20% credit here because of X time decay factor"). A Black Box vendor says "our AI figured it out, trust us." In an era of scrutiny, transparency is non-negotiable.

A staggering statistic from the MarTech stack utilization report highlights that marketers utilize just 49% of their martech stack capabilities [15]. This underutilization is often due to buying features that are too complex ("Black Box") for the team to understand or trust.

Real-World Scenario: An ecommerce brand evaluates two vendors. Vendor A offers a "proprietary AI engine" that promises 20% ROI lift but offers no visualization of the customer journey paths—just a final report. Vendor B offers a linear and time-decay model where the math is visible and adjustable. The brand chooses Vendor A. Three months later, the CEO asks, "Why did we attribute $50k to this podcast campaign?" The marketing director checks Vendor A's dashboard and cannot explain why the AI assigned that credit. The CEO loses trust in the data. Had they chosen Vendor B, they could have shown the specific touchpoint timestamps that justified the credit. The ability to explain the data is often more valuable than the sophistication of the algorithm itself.

EMERGING TRENDS AND CONTRARIAN TAKE

Emerging Trends 2025-2026: The dominant trend is the shift toward Hybrid Measurement or "Triangulation." This involves blending three distinct methodologies: Multi-Touch Attribution (MTA) for granular digital tracking, Marketing Mix Modeling (MMM) for holistic macro-level budgeting, and Incrementality Testing (lift studies) to validate the truth [16]. As signal loss continues, "AI Agents" are also emerging within these platforms—autonomous bots that don't just report data but actively suggest budget shifts (e.g., "Move $5k from Meta to TikTok") based on predictive outcomes [17].

Contrarian Take: The pursuit of "perfect accuracy" in attribution is a financial trap. Most businesses would get significantly higher ROI by abandoning the quest for a "Single Source of Truth" and instead accepting a "Margin of Error" approach. The mid-market is severely over-tooled; companies earning under $50M often buy enterprise-grade attribution suites when they simply lack the data volume to make the statistical models valid. For these companies, simple "last-click" combined with post-purchase surveys ("How did you hear about us?") often outperforms a $50,000/year algorithmic platform. The industry pushes complexity because complexity sells software, but for many, simplicity yields faster, clearer decisions.

COMMON MISTAKES

Over-Reliance on a Single Model: Far too many buyers set their platform to "Last Touch" or "First Touch" and never look back. This creates a self-fulfilling prophecy where you optimize only for the bottom or top of the funnel, eventually starving the other parts of your growth engine [18]. Relying on a single model distorts the understanding of what truly drives conversions.

Ignoring View-Through Data: In a privacy-conscious world, click-based attribution is dying. Buyers often make the mistake of ignoring "View-Through" (impressions that didn't click but converted later) because they think it's "fluff." In reality, for channels like YouTube, Connected TV, and social, view-through is the primary value driver. Ignoring it leads to cutting high-performing awareness channels [19].

Buying Before Data Readiness: The most expensive mistake is purchasing a platform before having a clean data infrastructure. If your UTM taxonomy is messy, your CRM data is full of duplicates, and your website events are untagged, an attribution tool will only accelerate the speed at which you make bad decisions. Fix the data layer first; buy the tool second.

QUESTIONS TO ASK IN A DEMO

  • "How do you specifically handle the data gaps caused by iOS 14+ and Safari ITP?" (If they say "we use AI to fill the gaps," ask for a whitepaper on the specific modeling methodology.) [20]
  • "Can you show me a report of the discrepancy between your platform's reported conversions and the ad platform's (e.g., Meta/Google) reported conversions?" (There will always be a discrepancy; you want to know if they are transparent about it.)
  • "What is the level of support included in the base price vs. premium support?" (Attribution tools break often due to site changes; you need to know if fixing a broken pixel costs extra.) [21]
  • "Do you offer raw data export to our data warehouse, and is there an extra fee for this?" (This is crucial for future-proofing your stack.) [20]
  • "How does your platform handle offline conversions and how are they matched to online users?" (Vital for B2B and Omnichannel retail.)

BEFORE SIGNING THE CONTRACT

Final Decision Checklist:

  • Data Ownership: Ensure the contract states that you own the computed attribution data, not just the raw input data. If you leave the vendor, you should be able to take your historical attribution reports with you.
  • Implementation SLA: Negotiate a "Go-Live" clause. If the implementation takes longer than 60 days due to vendor issues, you should have the right to pause billing or exit the contract.
  • Overage Protection: Hard-cap your event volume fees. Negotiate a clause that alerts you when you reach 80% of your tier limit, preventing surprise bills.
  • Deal-Breaker: Lack of Historical Data Replay. If the tool can't process your past 6-12 months of data to give you immediate insights on day one, you will be flying blind for months while the new data accumulates. Demand historical backfilling.

CLOSING

Choosing the right Marketing Attribution & Analytics Platform is one of the most complex decisions a marketing leader will make. It requires balancing technical constraints, budget realities, and team capabilities. If you need help navigating this landscape or want a sounding board for your specific use case, feel free to reach out.

Email: albert@whatarethebest.com

04

Research

Original reporting on this corner of the market.

All research

A typical enterprise software deal requires 266 touchpoints before signing a contract

May 17, 2026

Spotify's annual churn rate hits 30.9% despite 205 million premium subscribers

May 22, 2026

90% of autonomous analytics initiatives lack necessary governance structures

May 20, 2026
05

Questions people ask

Which Marketing Attribution & Analytics Platforms is best?

ZeroBounce holds the highest score in the category at 9.2, in Marketing Analytics Platforms for Ecommerce Brands. The right pick depends on the ranking that matches your use case, so start with the ranking list above.

Why are there 4 separate rankings?

Buyers in Marketing Attribution & Analytics Platforms have different jobs, so each ranking is scoped to one of them and weights the six criteria for that job. The same product can hold different ranks in different rankings.

How are the scores produced?

Documentation, pricing pages, security pages and third-party reviews are reviewed against six criteria. Each criterion records what was found and links its sources. Penalties pull the score down and are shown with their evidence. Rank follows the score. Full methodology.

06

More in Business Intelligence & Analytics

The whole group