Product & Web Analytics Platforms

Updated July 5, 2026

These are the specialized categories within Product & Web Analytics Platforms. Looking for something broader? See all Business Intelligence & Analytics Software categories.

Not sure which one is right for you?

Answer 4 quick questions and we'll match you with your best options

Find Your Best Match

How big is your team?

Just me
2 - 10
11 - 50
51 - 200
201 - 1,000
1,000+

What's your budget situation?

Free or open-source only
Free to start, pay later
Best value for money
Price isn't the main factor

What's your team's technical comfort level?

We want it to just work
We can handle some setup
We have developers who'll customize it

What's the ONE thing this tool must do well?

Step 1 of 4
1
9.1 / 10

Adobe Analytics is a powerful tool for consulting firms seeking to harness the power of data from web, mobile, and product interactions. It provides a single source of truth for data, enabling firms to make data-driven decisions, understand their clients better, and optimize their performance.

Best for Web & Product Analytics Platforms for Consulting Firms

Expert Take

Adobe Analytics is a leading platform in the web and product analytics space, particularly for consulting firms. Its comprehensive data analysis capabilities, real-time insights, and AI features make it a powerful tool for data-driven decision-making. Despite its complexity for beginners, it remains a top choice for firms needing advanced analytics.

Pros

  • Deep segmentation and predictive analytics
  • Native Adobe Experience Cloud integration
  • Analysis Workspace offers flexible reporting
  • Scalable for massive enterprise datasets

Cons

  • Steep learning curve for new users
  • Complex implementation requires experts
  • Standard version not HIPAA compliant
  • No free tier available

Best for teams that are

  • Organizations deeply integrated into the Adobe Experience Cloud ecosystem
  • Teams needing highly customizable reporting for diverse data sources

Skip if

  • Small businesses or startups due to high cost and implementation complexity
  • Users wanting a simple, plug-and-play analytics solution

Best for teams that are

  • Organizations deeply integrated into the Adobe Experience Cloud ecosystem
  • Teams needing highly customizable reporting for diverse data sources

Skip if

  • Small businesses or startups due to high cost and implementation complexity
  • Users wanting a simple, plug-and-play analytics solution

Pros

  • Leader in Gartner & Forrester reports
  • Deep segmentation and predictive analytics
  • Native Adobe Experience Cloud integration
  • Analysis Workspace offers flexible reporting
  • Scalable for massive enterprise datasets

Cons

  • Steep learning curve for new users
  • High cost with opaque pricing
  • Complex implementation requires experts
  • Standard version not HIPAA compliant
  • No free tier available

Expert Take

Adobe Analytics is a leading platform in the web and product analytics space, particularly for consulting firms. Its comprehensive data analysis capabilities, real-time insights, and AI features make it a powerful tool for data-driven decision-making. Despite its complexity for beginners, it remains a top choice for firms needing advanced analytics.

2
9.1 / 10
MyDataNinja

MyDataNinja is a powerful analytics platform designed for e-commerce marketers seeking precise, cookie-less attribution. By integrating with platforms like Shopify and Meta Ads, it transforms complex data into real-time profitability insights, all in a unified dashboard.

Best for Web & Product Analytics Platforms for Ecommerce Businesses

Expert Take

MyDataNinja stands out as a highly specialized, unified analytics command center for e-commerce marketers. By bypassing unreliable ad network metrics and utilizing server-side API integrations, it delivers precise, cookie-less attribution. We love how it transforms complex, siloed data from platforms like Shopify and Meta Ads into actionable, real-time profitability insights, all wrapped in a transparently priced package.

Pros

  • Unified dashboard for multiple ad accounts
  • Transparent pricing with generous free tier
  • Real-time ROAS and profitability insights

Cons

  • Lack of verified reviews on major platforms
  • Limited automated optimization capabilities

Pros

  • Cookie-less server-side tracking for attribution
  • Unified dashboard for multiple ad accounts
  • Transparent pricing with generous free tier
  • Real-time ROAS and profitability insights

Cons

  • Lack of verified reviews on major platforms
  • Steep learning curve for advanced tracking
  • Limited automated optimization capabilities

Expert Take

MyDataNinja stands out as a highly specialized, unified analytics command center for e-commerce marketers. By bypassing unreliable ad network metrics and utilizing server-side API integrations, it delivers precise, cookie-less attribution. We love how it transforms complex, siloed data from platforms like Shopify and Meta Ads into actionable, real-time profitability insights, all wrapped in a transparently priced package.

Snowflake Data Analytics for Retailers

Snowflake's Data Analytics for Retailers is a SaaS solution specifically designed to assist retail businesses in making data-driven decisions. It enables personalized shopping experiences and helps retailers adapt to changing consumer preferences, thereby meeting customer expectations more effectively. This is achieved through seamless data integration, real-time analytics, and scalable storage capabilities.

Best for Web & Product Analytics Platforms for Retail Stores

Expert Take

Snowflake Data Analytics for Retailers excels in providing a comprehensive data analytics solution tailored for the retail industry. Its strengths lie in real-time analytics, seamless integration, and scalable storage, making it a top choice for retailers seeking to enhance customer experiences and adapt to market changes. Despite its enterprise-level pricing, its robust capabilities justify its premium positioning.

Pros

  • Elastic scaling for seasonal retail peaks
  • Native support for semi-structured JSON data
  • PCI DSS Level 1 compliance for payments
  • Strong ecosystem with Blue Yonder & others

Cons

  • Unpredictable usage-based pricing model
  • Steep learning curve for cost optimization
  • Debugging performance issues can be complex
  • Requires manual warehouse sizing management

Best for teams that are

  • Retailers with massive datasets requiring scalable storage and processing
  • Data engineering teams needing a robust, cloud-native data warehouse

Skip if

  • Non-technical users expecting a drag-and-drop visualization tool
  • Small businesses with minimal data volume or simple reporting needs

Best for teams that are

  • Retailers with massive datasets requiring scalable storage and processing
  • Data engineering teams needing a robust, cloud-native data warehouse

Skip if

  • Non-technical users expecting a drag-and-drop visualization tool
  • Small businesses with minimal data volume or simple reporting needs

Pros

  • Seamless zero-copy data sharing with partners
  • Elastic scaling for seasonal retail peaks
  • Native support for semi-structured JSON data
  • PCI DSS Level 1 compliance for payments
  • Strong ecosystem with Blue Yonder & others

Cons

  • Unpredictable usage-based pricing model
  • Hidden storage costs from Time Travel
  • Steep learning curve for cost optimization
  • Debugging performance issues can be complex
  • Requires manual warehouse sizing management

Expert Take

Snowflake Data Analytics for Retailers excels in providing a comprehensive data analytics solution tailored for the retail industry. Its strengths lie in real-time analytics, seamless integration, and scalable storage, making it a top choice for retailers seeking to enhance customer experiences and adapt to market changes. Despite its enterprise-level pricing, its robust capabilities justify its premium positioning.

Amplitude Product Analytics

Amplitude is a powerful SaaS analytics platform specifically designed for marketing agencies. It enables professionals to leverage user data to gain meaningful insights and build better products. Its tools for digital analytics and experimentation make it an essential solution for agencies aiming to drive growth and user engagement.

Best for Web & Product Analytics Platforms for Marketing Agencies

Expert Take

Amplitude Product Analytics is a leading platform in the web and product analytics space, especially for marketing agencies. It excels in providing deep insights into user behavior, enabling data-driven decision-making. Its robust experimentation tools and advanced segmentation features make it a top choice for professionals aiming to optimize user engagement and growth.

Pros

  • Generous free plan (100k MTUs)
  • Deep behavioral & cohort analysis
  • SOC 2, ISO 27001 & HIPAA compliant
  • Strong Snowflake & warehouse integrations

Cons

  • Steep learning curve for beginners
  • Opaque Enterprise pricing structure
  • Complex setup requires planning
  • Session replay has reported bugs

Best for teams that are

  • Companies with high event volumes but lower user counts
  • Teams requiring advanced data governance and collaboration tools

Skip if

  • Small startups with limited budgets due to potential high costs
  • Organizations looking for a purely marketing-focused analytics tool

Best for teams that are

  • Companies with high event volumes but lower user counts
  • Teams requiring advanced data governance and collaboration tools

Skip if

  • Small startups with limited budgets due to potential high costs
  • Organizations looking for a purely marketing-focused analytics tool

Pros

  • Leader in Forrester Wave 2025
  • Generous free plan (100k MTUs)
  • Deep behavioral & cohort analysis
  • SOC 2, ISO 27001 & HIPAA compliant
  • Strong Snowflake & warehouse integrations

Cons

  • Steep learning curve for beginners
  • Expensive as user volume scales
  • Opaque Enterprise pricing structure
  • Complex setup requires planning
  • Session replay has reported bugs

Expert Take

Amplitude Product Analytics is a leading platform in the web and product analytics space, especially for marketing agencies. It excels in providing deep insights into user behavior, enabling data-driven decision-making. Its robust experimentation tools and advanced segmentation features make it a top choice for professionals aiming to optimize user engagement and growth.

Piwik Pro Ecommerce Analytics

Piwik Pro Ecommerce Analytics is a potent tool specifically designed to cater to the needs of ecommerce businesses. It offers rich insights, intuitive dashboards, custom reports, and heatmaps, all while ensuring easy privacy settings, thereby addressing the unique demands of the ecommerce industry such as conversion optimization and customer behavior analysis.

Best for Web & Product Analytics Platforms for Ecommerce Businesses

Expert Take

Piwik Pro Ecommerce Analytics stands out as a top-tier solution for ecommerce businesses, offering comprehensive insights and privacy-focused analytics. Its robust capabilities, combined with a strong focus on user privacy, make it a trusted choice for businesses aiming to optimize conversion rates and understand customer behavior.

Pros

  • GDPR, HIPAA, and SOC 2 Type II compliant
  • Generous free plan with 500,000 monthly actions
  • User interface similar to Universal Analytics
  • Built-in Consent Manager and CDP modules

Cons

  • Real-time reporting rated lower than competitors
  • E-commerce integration score lags behind leaders
  • Free plan data retention limited to 14 months

Best for teams that are

  • Companies seeking a secure, privacy-focused Google Analytics alternative
  • Enterprises needing integrated consent management

Skip if

  • Teams needing advanced product experimentation like feature flags
  • Users wanting a completely free tool without setup limits

Best for teams that are

  • Companies seeking a secure, privacy-focused Google Analytics alternative
  • Enterprises needing integrated consent management

Skip if

  • Teams needing advanced product experimentation like feature flags
  • Users wanting a completely free tool without setup limits

Pros

  • 100% data ownership with no data sampling
  • GDPR, HIPAA, and SOC 2 Type II compliant
  • Generous free plan with 500,000 monthly actions
  • User interface similar to Universal Analytics
  • Built-in Consent Manager and CDP modules

Cons

  • Real-time reporting rated lower than competitors
  • Support quality score lower than niche alternatives
  • E-commerce integration score lags behind leaders
  • Free plan data retention limited to 14 months

Expert Take

Piwik Pro Ecommerce Analytics stands out as a top-tier solution for ecommerce businesses, offering comprehensive insights and privacy-focused analytics. Its robust capabilities, combined with a strong focus on user privacy, make it a trusted choice for businesses aiming to optimize conversion rates and understand customer behavior.

Placer.ai Location Intelligence Software

Placer.ai is a powerful SaaS solution designed specifically for the retail industry, providing deep insights into customer foot traffic and location analytics. It helps retailers to understand their customer behavior better, optimize store performance, and make data-driven decisions related to store locations, marketing strategies, and operations.

Best for Web & Product Analytics Platforms for Retail Stores

Expert Take

Our analysis shows that Placer.ai distinguishes itself by replacing outdated radial trade areas with 'True Trade Area' mapping based on actual mobile signal data. Research indicates their commitment to 'privacy-by-design' through k-anonymity (minimum 50 devices) effectively balances granular insight with compliance. Based on documented integrations, their seamless connection with Snowflake and Esri makes them a powerful addition to enterprise data stacks, despite the high cost barrier for smaller entities.

Pros

  • Intuitive, user-friendly dashboard interface
  • Strong privacy with k-anonymity standards
  • Direct Snowflake and Esri integrations
  • Free version available for basic insights

Cons

  • Expensive for small businesses ($1k+/mo)
  • No transparent public pricing
  • Reporting lacks deep customization options
  • Support response can be slow

Best for teams that are

  • Brick-and-mortar retailers needing foot traffic data and trade area analysis
  • Commercial real estate professionals evaluating site selection and tenant performance

Skip if

  • Purely online e-commerce businesses with no physical store presence
  • Small businesses unable to afford premium location intelligence tools

Best for teams that are

  • Brick-and-mortar retailers needing foot traffic data and trade area analysis
  • Commercial real estate professionals evaluating site selection and tenant performance

Skip if

  • Purely online e-commerce businesses with no physical store presence
  • Small businesses unable to afford premium location intelligence tools

Pros

  • Precise 'True Trade Area' mapping
  • Intuitive, user-friendly dashboard interface
  • Strong privacy with k-anonymity standards
  • Direct Snowflake and Esri integrations
  • Free version available for basic insights

Cons

  • Expensive for small businesses ($1k+/mo)
  • Inaccurate in low-traffic/poor-signal areas
  • No transparent public pricing
  • Reporting lacks deep customization options
  • Support response can be slow

Expert Take

Our analysis shows that Placer.ai distinguishes itself by replacing outdated radial trade areas with 'True Trade Area' mapping based on actual mobile signal data. Research indicates their commitment to 'privacy-by-design' through k-anonymity (minimum 50 devices) effectively balances granular insight with compliance. Based on documented integrations, their seamless connection with Snowflake and Esri makes them a powerful addition to enterprise data stacks, despite the high cost barrier for smaller entities.

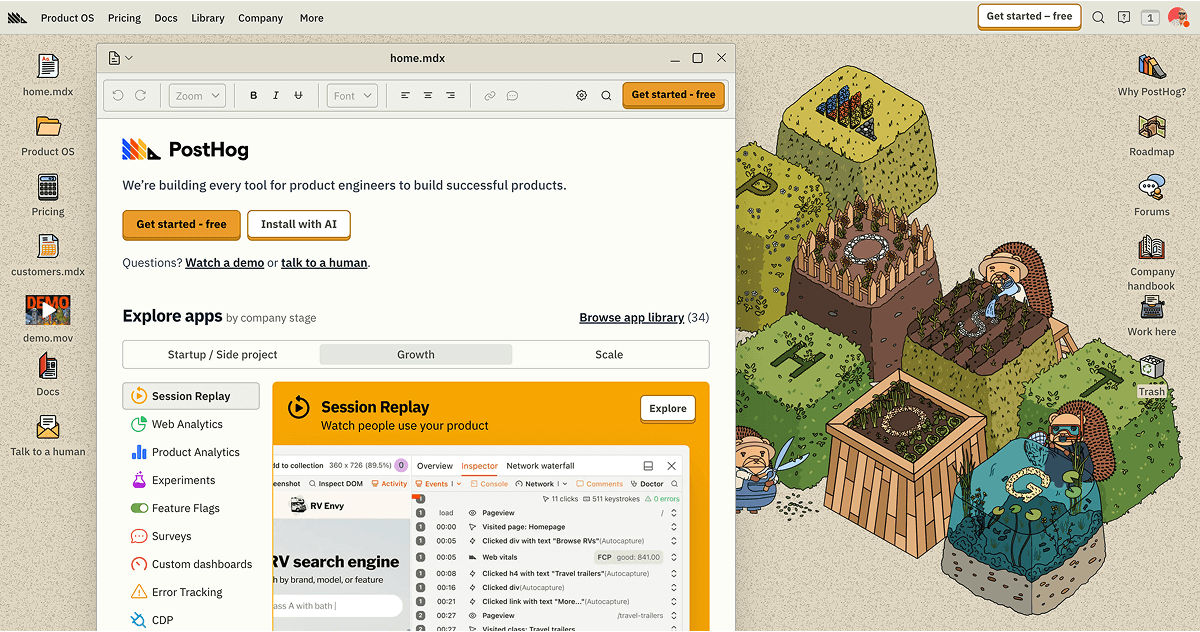
PostHog Dev Tool Suite

PostHog is a one-stop-shop for product engineers, offering a comprehensive suite of developer tools. This platform is specifically designed to meet the needs of marketing agencies, enabling fast and efficient product development, testing, measuring, and shipping. It aids in driving successful product outcomes with its built-in web & product analytics feature.

Best for Web & Product Analytics Platforms for Marketing Agencies

Expert Take

PostHog Dev Tool Suite excels as a comprehensive platform for marketing agencies, offering robust analytics and developer tools. Its open-source nature and self-hosting options enhance flexibility and scalability, making it a valuable asset for diverse agency needs. Despite its complexity, it remains a top choice for those seeking detailed product insights.

Pros

  • Generous free tier (1M events/mo)
  • Open-source and self-hosting options
  • Direct SQL access to data
  • Native feature flag integration

Cons

  • Steep learning curve for non-tech users
  • Mobile replay uses low-fidelity wireframes
  • Self-hosting requires DevOps expertise
  • Limited out-of-box 3rd party integrations

Best for teams that are

  • Teams wanting an all-in-one tool for analytics and feature flags
  • Developers who prefer open-source and self-hosted options

Skip if

  • Non-technical marketing teams needing simple dashboards
  • Teams looking for a pure marketing attribution tool

Best for teams that are

  • Teams wanting an all-in-one tool for analytics and feature flags
  • Developers who prefer open-source and self-hosted options

Skip if

  • Non-technical marketing teams needing simple dashboards
  • Teams looking for a pure marketing attribution tool

Pros

  • All-in-one analytics, replay, and flags
  • Generous free tier (1M events/mo)
  • Open-source and self-hosting options
  • Direct SQL access to data
  • Native feature flag integration

Cons

  • Steep learning curve for non-tech users
  • Unpredictable usage-based pricing
  • Mobile replay uses low-fidelity wireframes
  • Self-hosting requires DevOps expertise
  • Limited out-of-box 3rd party integrations

Expert Take

PostHog Dev Tool Suite excels as a comprehensive platform for marketing agencies, offering robust analytics and developer tools. Its open-source nature and self-hosting options enhance flexibility and scalability, making it a valuable asset for diverse agency needs. Despite its complexity, it remains a top choice for those seeking detailed product insights.

Supermetrics Marketing Intelligence

Supermetrics is a potent tool designed specifically for marketing agencies and brands. It streamlines data management and analytics by connecting various data sources, curating actionable insights, and facilitating data activation. Its ability to unify marketing data into one central location addresses the industry’s need for efficient data handling, analysis, and decision-making.

Best for Web & Product Analytics Platforms for Marketing Agencies

Expert Take

Supermetrics Marketing Intelligence excels in providing comprehensive data management and analytics solutions for marketing agencies. Its wide range of data connectors, customizable analytics, and automation features make it a top choice in its category. While it may present a learning curve for beginners, its robust capabilities justify its premium positioning.

Pros

  • SOC 2 Type II & GDPR compliant
  • Direct integration with Google Sheets/BigQuery
  • No-code automated reporting workflows
  • Trusted by 200,000+ organizations

Cons

  • Significant price increases (40-60%) reported
  • Complex tiered pricing structure
  • Slow queries with large datasets
  • US vs EU pricing discrepancies

Best for teams that are

  • SMBs to Enterprises needing simple data connectors
  • Teams comfortable using spreadsheets for data analysis

Skip if

  • Teams needing complex data transformation or warehousing
  • Businesses needing to store large amounts of historical data

Best for teams that are

  • SMBs to Enterprises needing simple data connectors
  • Teams comfortable using spreadsheets for data analysis

Skip if

  • Teams needing complex data transformation or warehousing
  • Businesses needing to store large amounts of historical data

Pros

  • Connects to 150+ marketing platforms
  • SOC 2 Type II & GDPR compliant
  • Direct integration with Google Sheets/BigQuery
  • No-code automated reporting workflows
  • Trusted by 200,000+ organizations

Cons

  • Significant price increases (40-60%) reported
  • Occasional connector breakages and failures
  • Complex tiered pricing structure
  • Slow queries with large datasets
  • US vs EU pricing discrepancies

Expert Take

Supermetrics Marketing Intelligence excels in providing comprehensive data management and analytics solutions for marketing agencies. Its wide range of data connectors, customizable analytics, and automation features make it a top choice in its category. While it may present a learning curve for beginners, its robust capabilities justify its premium positioning.

Tableau: Data Visualization Tool

Tableau is a robust business intelligence and analytics software specifically designed for retail stores. It allows retailers to visually analyse their data, spot trends, and make data-driven decisions. Its advanced AI/ML capabilities provide predictive insights, while the governance feature ensures data security and compliance. The visual storytelling aspect makes complex data easily understandable, helping retailers to act quickly.

Best for Web & Product Analytics Platforms for Retail Stores

Expert Take

Tableau is a leading data visualization tool for retail analytics, offering robust capabilities in visual storytelling and predictive insights. It is recognized for its user-friendly interface and comprehensive governance features, making it a top choice for retailers seeking data-driven decision-making.

Pros

  • Massive library of native data connectors
  • Deep integration with Salesforce ecosystem
  • Robust enterprise security and governance
  • Vibrant community and learning resources

Cons

  • Steep learning curve for advanced features
  • Performance lags with massive datasets
  • Complex server setup for on-premise
  • Data prep requires separate tool (Prep)

Best for teams that are

  • Data analysts requiring highly customizable, pixel-perfect visualizations
  • Large enterprises with dedicated data teams to manage complex dashboards

Skip if

  • Non-technical users seeking simple, instant answers without training
  • Organizations with limited budgets due to high licensing and maintenance costs

Best for teams that are

  • Data analysts requiring highly customizable, pixel-perfect visualizations
  • Large enterprises with dedicated data teams to manage complex dashboards

Skip if

  • Non-technical users seeking simple, instant answers without training
  • Organizations with limited budgets due to high licensing and maintenance costs

Pros

  • Industry-leading visual analytics capabilities
  • Massive library of native data connectors
  • Deep integration with Salesforce ecosystem
  • Robust enterprise security and governance
  • Vibrant community and learning resources

Cons

  • Steep learning curve for advanced features
  • High cost compared to some competitors
  • Performance lags with massive datasets
  • Complex server setup for on-premise
  • Data prep requires separate tool (Prep)

Expert Take

Tableau is a leading data visualization tool for retail analytics, offering robust capabilities in visual storytelling and predictive insights. It is recognized for its user-friendly interface and comprehensive governance features, making it a top choice for retailers seeking data-driven decision-making.

Funnel Marketing Intelligence Platform

Funnel is a premier marketing analytics platform specifically designed for marketing agencies. It enables businesses to aggregate data from an extensive range of platforms, providing powerful reporting and data modeling capabilities. This addresses a key need in the industry to have a consolidated view of marketing data across various channels, enabling agencies to make informed data-driven decisions.

Best for Web & Product Analytics Platforms for Marketing Agencies

Expert Take

Funnel Marketing Intelligence Platform excels in data integration and reporting capabilities, making it a top choice for marketing agencies. It aggregates data from over 500 platforms, providing comprehensive insights. Despite requiring initial setup and technical know-how, its value in data-driven decision-making is significant.

Pros

  • No-code data transformation and normalization
  • Stores historical data (Data Hub)
  • ISO 27001 and SOC 2 certified
  • Exports to all major BI tools

Cons

  • Flexpoint pricing can be unpredictable
  • Steep learning curve for beginners
  • Support removed from lower tiers
  • 30-day cancellation notice required

Best for teams that are

  • Enterprises needing to centralize data from hundreds of sources
  • Teams requiring automated data mapping and normalization

Skip if

  • Small teams needing a simple, low-cost data connector
  • Businesses with very simple, single-channel reporting needs

Best for teams that are

  • Enterprises needing to centralize data from hundreds of sources
  • Teams requiring automated data mapping and normalization

Skip if

  • Small teams needing a simple, low-cost data connector
  • Businesses with very simple, single-channel reporting needs

Pros

  • 600+ pre-built marketing data connectors
  • No-code data transformation and normalization
  • Stores historical data (Data Hub)
  • ISO 27001 and SOC 2 certified
  • Exports to all major BI tools

Cons

  • Flexpoint pricing can be unpredictable
  • Extra fees for basic connectors
  • Steep learning curve for beginners
  • Support removed from lower tiers
  • 30-day cancellation notice required

Expert Take

Funnel Marketing Intelligence Platform excels in data integration and reporting capabilities, making it a top choice for marketing agencies. It aggregates data from over 500 platforms, providing comprehensive insights. Despite requiring initial setup and technical know-how, its value in data-driven decision-making is significant.

Loading comparison data…

How We Rank Products

Our Evaluation Process

Web & Product Analytics Platforms are evaluated based on their documented features, such as data visualization, user segmentation, and multi-channel tracking. Pricing transparency is assessed to ensure clarity in cost structures. Compatibility with existing business systems is crucial, focusing on the ease of integrations and data import/export capabilities. Customer feedback from third-party sources provides insights into user satisfaction and platform reliability.

Verification

  • Products evaluated through comprehensive research and analysis of industry standards and user feedback.
  • Rankings based on a thorough examination of features, customer reviews, and expert evaluations.
  • Selection criteria focus on key performance metrics and user satisfaction ratings in web and product analytics platforms.

Score Breakdown

0.0 / 10

About Product & Web Analytics Platforms

What Are Product & Web Analytics Platforms?

This category covers software used to track, measure, and analyze user behavior across digital properties throughout the entire customer journey: from the first anonymous website visit through account creation, feature adoption, and long-term retention. It sits downstream from AdTech (which focuses on impression/click delivery) and upstream from CRM (which manages known relationships). It includes both general-purpose platforms that aggregate session-based web metrics and specialized product intelligence tools that utilize event-based tracking to optimize user experience (UX) and feature engagement.

In the modern enterprise stack, Product & Web Analytics Platforms serve as the central nervous system for decision-making. They bridge the gap between marketing (how did we get them?) and product (what did they do?). While historically treated as separate disciplines—web analytics for marketers tracking traffic sources, and product analytics for engineers tracking feature usage—the category has converged. Today, the most sophisticated buyers seek platforms that can connect the "anonymous visitor" to the "power user," providing a unified view of the customer lifecycle. This software is critical not just for counting pageviews, but for answering fundamental business questions: Why do users churn? Which features drive upsells? And where is the friction in the digital experience?

History of the Category

The evolution of Product & Web Analytics is a timeline of moving from vanity metrics to actionable intelligence. In the mid-1990s, the internet was a collection of static pages, and "analytics" meant server log files. IT administrators would parse these text files to see how many "hits" a server received. Tools like WebTrends (founded in 1993) and Analog (1995) emerged to turn these logs into readable reports. This was the era of the "Hit Counter"—a public-facing badge of honor that measured server load rather than human behavior. The gap here was accessibility; data was locked in the server room, unavailable to marketers.

The second wave began in the mid-2000s with the democratization of tagging. The acquisition of Urchin Software by Google in 2005, which became Google Analytics, fundamentally shifted the market. It moved analytics from server logs to JavaScript tags executed in the client’s browser. This shift allowed for the tracking of "sessions" and "users" rather than just server requests. It solved the problem of accessibility but introduced a new one: data volume without context. Organizations became rich in data but poor in insight, focusing on aggregate metrics like "bounce rate" and "time on site" that described what happened, but rarely who did it or why.

The third wave, rising in the early 2010s alongside the mobile app boom, was the birth of Product Analytics. Traditional session-based web analytics failed in the mobile world, where "pageviews" didn't exist. This gap created the need for event-based analytics—tracking specific actions like "song played," "message sent," or "cart updated." Companies like Mixpanel and Amplitude emerged to serve this need, shifting the focus from acquisition (getting users to the door) to retention (keeping them inside).

Today, we are in the midst of a fourth wave: Consolidation and the Warehouse-Native era. The historical divide between "web" (marketing) and "product" (engineering) data led to massive silos. The current market is defined by platforms that ingest data from both sources into a unified Customer Data Platform (CDP) or read directly from cloud data warehouses like Snowflake. The buyer expectation has evolved from "give me a dashboard" to "give me a predictive model," with modern platforms expected to not only report on the past but use AI to predict future churn and lifetime value.

What to Look For

When evaluating Product & Web Analytics Platforms, buyers must look beyond the user interface (UI) and scrutinize the data architecture. The most critical evaluation criterion is the data model. Does the platform rely on sessions (grouping interactions by time) or events (tracking specific user actions)? For pure content sites, session-based models suffice. For SaaS products and complex e-commerce, an event-based model is non-negotiable because it allows you to analyze nonlinear user journeys that span days or weeks.

Identity resolution is another pivot point. A robust platform must be able to stitch together a user's journey across devices—connecting the anonymous visitor on a mobile browser to the logged-in user on a desktop app. Ask vendors specifically how they handle "retroactive aliasing" (assigning past anonymous behavior to a newly identified user). If the tool cannot do this effectively, your attribution data will be permanently broken, showing high acquisition costs with no corresponding downstream value.

Red flags often appear in the form of hidden costs and data ownership limits. Be wary of vendors that charge based on "monthly tracked users" (MTU) without hard caps, as a single viral marketing campaign can blow your annual budget in a week. Another major warning sign is data sampling. Some platforms, particularly free or entry-level versions of enterprise tools, will only analyze a subset of your data once you hit a certain volume. For directional trends, this is fine; for financial reporting or precise funnel analysis, sampling renders the data useless. Finally, ask: "Can I export the raw, granular data?" If the answer is no, or if it requires an expensive add-on, you are renting your insights rather than owning them.

Industry-Specific Use Cases

Retail & E-commerce

In retail, the primary analytic focus is the shopping funnel and merchandising efficiency. Unlike SaaS, where engagement is the goal, e-commerce analytics must solve for cart abandonment and average order value (AOV). Retailers require platforms that offer advanced merchandising heatmaps—visualizing not just where users click, but which products on a category page are viewed but ignored (low click-through rate). This specific insight drives inventory decisions, helping merchandisers rotate stock or adjust pricing. Furthermore, omnichannel visibility is paramount. Retailers need to track the "ROPO" effect (Research Online, Purchase Offline), often requiring integrations with Point of Sale (POS) systems to close the loop on attribution. As noted by [1], implementing unified inventory and order management systems alongside analytics can improve inventory accuracy to 98% and reduce stockouts by 50%, directly impacting the bottom line.

Healthcare

Healthcare organizations operate under strict regulatory environments (HIPAA in the US, GDPR in Europe) that fundamentally alter how they select analytics tools. The priority here is data sovereignty and anonymization. Healthcare providers use these platforms to map patient journeys—from finding a doctor to booking an appointment and accessing telehealth portals. However, they must ensure that Personal Health Information (PHI) is never inadvertently captured in URL query strings or form fields. Advanced platforms for healthcare offer "data masking" by default, automatically scrubbing inputs. Use cases focus on patient outcomes and operational efficiency, such as predicting patient loads to optimize staffing. According to research, predictive analytics in healthcare can be used to forecast patient volumes and resource needs, reducing wait times and improving care delivery [2].

Financial Services

For banks, insurers, and fintech, analytics serves a dual purpose: conversion optimization and fraud detection. The application process for a mortgage or credit card is complex; analytics tools are used to identify exactly which form field causes a user to drop off. Is the "upload ID" step broken on Android devices? Is the income verification step taking too long? Beyond UX, financial services leverage behavioral biometrics—analyzing mouse movements, typing speed, and navigation patterns—to flag bot activity or fraudulent account takeovers. Security compliance (SOC 2 Type II, ISO 27001) is the gatekeeper criterion; if a vendor cannot prove enterprise-grade encryption and granular access controls, features don't matter.

Manufacturing

Manufacturing analytics has shifted from the back office to the factory floor, driven by the Industrial Internet of Things (IIoT). Here, product analytics often refers to the analysis of the connected device itself rather than a website. Manufacturers use these platforms to monitor equipment health, predict maintenance needs, and optimize production throughput. The "user" in this context might be a machine operator or the machine itself. The critical requirement is the ability to handle high-velocity time-series data and integrate with legacy ERP and SCADA systems. [3] notes that predictive maintenance enabled by IoT sensors is a primary use case, allowing manufacturers to minimize unplanned downtime and extend machinery lifespan.

Professional Services

Consultancies and agencies use analytics platforms to validate their own value to clients. For a digital marketing agency, the platform is the reporting engine that proves Return on Ad Spend (ROAS). For management consultants, analytics are used to diagnose client inefficiencies. The unique need here is multi-tenancy and white-labeling. A professional services firm needs to create distinct, secure data environments for Client A and Client B within a single login, often rebranding the dashboard to look like a proprietary tool. The workflow focuses heavily on automated reporting and "client-facing" dashboards that abstract complex data into executive summaries. As highlighted by [4], the highest value in this sector comes not just from reporting data, but from "data analysis" contracts where consultants use advanced segmentation to recommend specific strategic actions.

Subcategory Overview

Web & Product Analytics Platforms for Ecommerce Businesses

This subcategory is distinct because it demands a holistic view of the Profit & Loss (P&L), not just conversion rates. While generic tools track hits, specialized tools for ecommerce businesses integrate deeply with inventory, shipping, and cost-of-goods-sold (COGS) data to calculate Gross Margin ROI per channel. A generic tool might tell you that Facebook Ads brought in 1,000 sales; a tool in this niche tells you that those sales resulted in a net loss due to high return rates and low margins on the specific SKUs purchased. The specific pain point driving buyers here is "profit blindness"—marketing teams scaling ad spend on products that lose money on every unit. For a deeper analysis of the tools that solve this, review our guide to Web & Product Analytics Platforms for Ecommerce Businesses.

Web & Product Analytics Platforms for Consulting Firms

The differentiator for consulting firms is the requirement for collaborative governance and auditing. Unlike a single company analyzing its own data, consulting firms need tools that allow them to audit a client's existing setup, identify "dirty data," and implement a clean tracking taxonomy without destroying historical data. A workflow unique to this niche is the "audit overlay," where consultants can visualize tag firing on a client's live site to debug implementation errors in real-time. The pain point is the "black box" client setup—consultants cannot fix what they cannot diagnose. To see which platforms facilitate this high-level auditing, explore Web & Product Analytics Platforms for Consulting Firms.

Web & Product Analytics Platforms for Marketing Agencies

Speed of reporting and multi-client aggregation define this niche. Agencies manage dozens of accounts simultaneously. A generic platform requires logging in and out of different workspaces; specialized agency tools provide a master command center to view KPIs across 50+ clients on one screen. The critical workflow here is "automated anomaly detection" across a portfolio—alerting the agency immediately if Client X's conversion rate drops by 20% so they can act before the client complains. The driving pain point is "reporting fatigue," where account managers waste hours manually compiling spreadsheets. For tools that automate this command center, check our guide to Web & Product Analytics Platforms for Marketing Agencies.

Web & Product Analytics Platforms for Ecommerce Brands

D2C (Direct-to-Consumer) brands have different needs than general retailers; they care intensely about Brand Equity and Customer Lifetime Value (CLV). Unlike retailers selling third-party goods, D2C brands own the product and the relationship. This niche focuses on "cohort analysis" to measure how specific product launches impact long-term retention. A workflow unique to this group is analyzing the "unboxing experience" via sentiment analysis on reviews and social mentions integrated directly into the analytics dashboard. The pain point is high Customer Acquisition Cost (CAC); generic tools don't show which creative assets bring in high-LTV customers versus one-time buyers. Learn more about brand-centric tools in our section on Web & Product Analytics Platforms for Ecommerce Brands.

Web & Product Analytics Platforms for Retail Stores

This subcategory bridges the physical and digital worlds. It is not just about website traffic; it is about the digital influence on foot traffic. Specialized tools here integrate with store beacons, Wi-Fi logins, and loyalty cards to track the "Research Online, Buy Offline" journey. A specific workflow is tracking BOPIS (Buy Online, Pickup In Store) efficiency—measuring the time between digital checkout and physical pickup. The pain point driving buyers here is the inability to attribute physical sales to digital marketing spend, leading to under-investment in digital channels. For solutions that close this gap, see Web & Product Analytics Platforms for Retail Stores.

Integration & API Ecosystem

In the analytics space, integration is not a feature; it is the infrastructure. A standalone analytics tool is a silo, and data silos are the primary killer of digital transformation projects. According to [5], 81% of IT leaders report that data silos are hindering their digital transformation efforts, and the average enterprise has 897 applications, only 29% of which are integrated. This fragmentation means that for most companies, the "single view of the customer" is a myth.

Consider a scenario for a mid-sized professional services firm with 50 employees. They use Salesforce for CRM, NetSuite for billing, and a specialized web analytics tool. If these systems are not tightly integrated via robust APIs, a "Client Health" dashboard is impossible to build. The analytics tool might show high engagement on the website, while NetSuite shows the client is 90 days overdue on invoices. Without integration, the account manager sees a happy client (high web usage) and attempts an upsell, unaware that the finance team is about to pause service for non-payment. This embarrassment—and potential churn—is a direct result of poor integration. Buyers must look for pre-built, bi-directional connectors that allow data to flow out of the analytics platform into operational tools (like Slack alerts or CRM fields), not just into the analytics tool for reporting.

Security & Compliance

Security in product analytics has graduated from a checkbox to a boardroom-level risk. The regulatory landscape has shifted aggressively with GDPR in Europe, CCPA in California, and similar laws globally. The penalties for non-compliance are existential. In May 2023, the Irish Data Protection Commission fined Meta €1.2 billion for mishandling user data transfers between the EU and the US [6]. While this is a headline case, it sets the precedent that operational negligence regarding user data location and privacy is punishable by massive fines.

For a real-world buyer, imagine a healthcare app based in Germany that uses a US-based product analytics vendor. If that vendor stores IP addresses or unencrypted patient IDs on US servers without the correct legal frameworks (like the Data Privacy Framework), the healthcare app is non-compliant. A single audit could shut them down. Security evaluation must go beyond "is it encrypted?" Buyers must ask: "Can I choose the geographic region where my data resides?" (Data Residency). "Can I delete a specific user's data instantly upon request?" (Right to be Forgotten). "Does the platform support PII masking at the SDK level?" This last point is crucial; once Personally Identifiable Information (PII) hits the analytics server, the compliance breach has already happened. The best tools prevent PII from ever leaving the user's device.

Pricing Models & TCO

Pricing for analytics platforms is notoriously opaque and prone to "bill shock." The two dominant models are volume-based (events) and user-based (MTUs - Monthly Tracked Users). Total Cost of Ownership (TCO) calculations often fail because buyers underestimate their own growth. Research by Zylo indicates that organizations waste an average of $18 million annually on unused SaaS licenses and shelfware [7]. In the analytics sector, waste comes not just from unused seats, but from "over-tracking."

Let’s walk through a TCO scenario for a hypothetical B2B SaaS company with 25 employees and 10,000 active users.

  • Model A (MTU Pricing): The vendor charges $500/month for up to 10,000 MTUs. It looks cheap. However, the company launches a free trial marketing campaign. Traffic spikes to 50,000 visitors. Even though only 500 convert, the platform counts all 50,000 as "users." The bill jumps to $2,500/month instantly due to overage tiers.
  • Model B (Event Pricing): The vendor charges $500/month for 10 million events. The engineering team, excited about the new tool, adds a tracking code to a "scroll" event that fires every pixel a user scrolls. Suddenly, a single user session generates 5,000 events. The 10 million event cap is hit in three days.
The "contrarian" advice here is to negotiate hard caps and ingestion filters. Buyers should demand the ability to block specific high-volume events at the ingestion level so they don't count toward the bill. Without this, the TCO can easily triple within the first quarter of implementation.

Implementation & Change Management

The technical installation of a tracking script is easy; the organizational implementation of an analytics culture is incredibly hard. Failure rates for large-scale software implementations remain alarmingly high. Gartner research predicts that through 2027, more than 70% of ERP and major enterprise initiatives will fail to fully meet their original business goals [8]. While this stat targets ERP, the dynamic is identical in enterprise analytics: the software works, but people don't use it.

A common failure scenario involves a 50-person retail company. They buy a premium analytics tool. The Head of Product defines a complex "Tracking Plan" with 200 distinct events. Developers spend three weeks implementing it. Once live, the marketing team finds the event names confusing ("btn_clk_home_v2" vs. "Sign Up Click"). Because they don't understand the data, they stop logging in. Six months later, the contract comes up for renewal, and usage logs show only the data scientist uses the tool. To avoid this, implementation must include a Data Dictionary—a living document, accessible to all, that translates "developer speak" into "business speak." Change management requires forcing the tool into existing workflows: auto-emailing weekly PDF dashboards to executives and pushing "win" alerts into Slack channels so the team sees value without logging in.

Vendor Evaluation Criteria

When selecting a vendor, the conversation has shifted from "feature lists" to "ecosystem fit." According to G2's 2025 Buyer Behavior Report, 57% of buyers anticipate increasing their software spending, but they are doing so with a tighter focus on ROI and value demonstration [9]. Buyers are no longer impressed by the sheer number of charts a tool can generate.

Critical evaluation criteria now include Data Portability and Query Speed.

  • Data Portability: Can I get my data out into Snowflake/BigQuery easily? If a vendor holds data hostage or charges for export, they are a legacy risk.
  • Query Speed: During the Proof of Concept (POC), load the tool with a realistic dataset (e.g., 5 million rows). Run a complex query (e.g., "Show me retention over 12 months broken down by acquisition channel"). If the wheel spins for 30 seconds, walk away. In a daily workflow, latency kills curiosity. If it takes too long to get an answer, users stop asking questions.
  • Support SLA: Don't just ask about uptime. Ask about "Support Response Time" for technical implementation questions. When a tracking bug breaks your checkout data on Black Friday, you need a 1-hour response time, not a "24-48 hour" standard ticket.

Emerging Trends and Contrarian Take

Emerging Trends (2025-2026): The most significant shift is the move toward Agentic AI. We are moving from "Descriptive Analytics" (what happened) and "Predictive Analytics" (what will happen) to "Agentic Analytics" (fixing it automatically). IoT Analytics reports that the market is entering a wave of "agentic and physical AI," where systems don't just recommend actions but execute them [10]. In practice, this means an analytics platform detecting a drop in conversion on a checkout page and automatically deploying a pre-tested simplified layout without human intervention.

Contrarian Take: The Mid-market is Overserved and Overpaying. Most mid-sized businesses ($10M-$50M revenue) would get higher ROI from hiring one dedicated data analyst than from upgrading to an "Enterprise" analytics tier. The market has convinced buyers that they need "AI-powered predictive cohorts" and "multi-touch attribution modeling." The reality? 90% of a company's growth problems can be solved with simple funnel analysis and accurate basic segmentation. Companies routinely buy Ferrari-level platforms to drive to the grocery store. The "hard truth" is that software cannot fix a lack of curiosity; if you aren't acting on basic data, advanced AI insights will just be more noise you ignore.

Common Mistakes

The most pervasive mistake in buying analytics software is "Tracking Plan Bloat." Companies often start with the mindset of "let's track everything just in case." This leads to a noisy, unusable dataset where critical signals are lost in a sea of irrelevant clicks. A cluttered implementation is harder to clean up than a fresh install. It is far better to track 20 core events perfectly than 200 events loosely.

Another critical error is ignoring "Identity Resolution" strategy. Many teams implement tracking without deciding how to handle users who switch devices. This results in a "user count" that is 2x-3x higher than reality, artificially deflating conversion rates and retention metrics. If you treat one person on a phone and a laptop as two people, every single retention metric you have is a lie.

Finally, companies mistake installation for adoption. They celebrate the day the tracking code goes live as the finish line. In reality, that is the starting line. Without a dedicated "internal champion" whose job is to build dashboards for other teams and train them on interpretation, the tool becomes expensive shelfware within six months.

Questions to Ask in a Demo

  • "Show me exactly how you handle retroactive aliasing when a user identifies themselves after browsing anonymously." (If they stumble on this, their identity resolution is weak).
  • "What are the hard limits on data cardinality?" (i.e., If I send a distinct URL for every page view, will your reports break?)
  • "Can I query the raw data using SQL directly within the platform, or do I have to export it?"
  • "Demonstrate how to exclude internal employee traffic from the data without relying on IP addresses (which change with remote work)."
  • "What happens to my data if I cancel the contract? Do I get a dump, or is it deleted immediately?"

Before Signing the Contract

Decision Checklist:

  • Data Ownership: Confirm that the contract explicitly states you own the generated data, not the vendor.
  • Overage Protection: Negotiate a "soft cap" or a grace period for data spikes. Ensure you aren't automatically billed a penalty rate if a marketing campaign goes viral.
  • Sandbox Environment: Ensure the license includes a staging/sandbox environment so you can test new tracking codes without polluting your production data.
  • Implementation Support: Do not sign without a specified number of hours of "implementation engineering" support. You will need technical help, and paying $250/hour for it later is a bad deal.
  • SLA Penalties: The Service Level Agreement should have teeth. If the data collection API goes down, you lose irrevocable data. The vendor should owe you service credits for that downtime.

Closing

Selecting the right Product & Web Analytics platform is a foundational decision for any modern business. It is the difference between flying blind and navigating with precision. If you have specific questions about your stack or need a sounding board for your evaluation strategy, feel free to reach out.

Email: albert@whatarethebest.com

Quick one question survey

Thanks for your input!
Your response has been recorded.