

| Year | Power BI (%) | Tableau (%) |
|---|---|---|
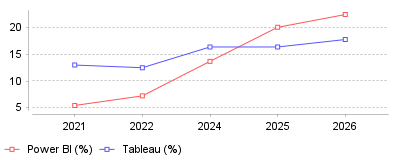
| 2021 | 5.4 | 13 |
| 2022 | 7.2 | 12.5 |
| 2024 | 13.7 | 16.4 |
| 2025 | 20.1 | 16.4 |
| 2026 | 22.5 | 17.8 |
This data illustrates the rapid acceleration of Microsoft Power BI's market share compared to its primary competitor, Tableau, between 2021 and 2026. While Tableau maintained an early lead as the industry standard for data visualization, Power BI's adoption surged from roughly 5.4% in 2021 to over 22% by 2026, establishing a new market hierarchy where Microsoft clearly leads [1].
On a micro level, this indicates that organizations are increasingly prioritizing cost-effective, easily integrated reporting tools over specialized, standalone visualization software. Power BI’s inclusion in the Office 365 ecosystem allows companies to scale their data analytics efficiently without expensive, separate licensing [2]. On a macro level, the business intelligence industry is moving away from "visualization-first" platforms toward unified, AI-augmented decision engines [3]. The strategic focus has shifted from creating aesthetically complex charts to enabling quick, self-service insights for non-technical business users through natural language processing and automated data preparation [4].
This power shift underscores a broader digital transformation where data literacy is being democratized across all levels of a company, rather than being siloed in IT or data science departments. By utilizing tools that non-technical staff already understand, organizations see up to 40% higher user adoption rates in platforms like Power BI compared to Tableau [4]. Consequently, businesses can make data-driven decisions significantly faster, moving from reactive historical reporting to proactive, real-time operational execution [5].
The primary catalyst for Power BI's explosive growth is Microsoft’s aggressive bundling strategy with Office 365 and Azure, which drastically lowers the barrier to entry and total cost of ownership [6]. Additionally, the recent boom in generative AI has allowed Microsoft to integrate Copilot directly into Power BI, enabling users to generate actionable reports simply by asking questions in plain English [7]. Tableau, while retaining unmatched depth in exploratory visual analytics, carries a steeper learning curve and a higher price tag that can be prohibitive for widespread enterprise deployments [8]. Finally, the shift toward remote and hybrid work likely accelerated the need for cloud-native, collaborative BI tools that integrate seamlessly into daily workflow platforms like Microsoft Teams [9].
The data definitively shows that the data visualization and reporting market has crowned a new leader driven by software ecosystem synergy and artificial intelligence capabilities. While Tableau remains the gold standard for dedicated data scientists requiring deep visual customization, Power BI has won the broader enterprise market through accessibility, affordability, and AI automation. The key takeaway for business leaders is that the future of business intelligence lies in embedded, frictionless analytics that live directly within the operational tools employees use every day.
Enterprise spending on analytics software rises consistently across all major global sectors. Market valuation models show sustained double-digit growth. End-user adoption rates remain stagnant despite these financial investments. Software buyers struggle to convert purchased licenses into active daily usage. Infrastructure projects meant to support these tools frequently exceed their original budgets. Furthermore, federal regulatory bodies now demand faster public disclosure of operational failures. This combination of rising costs, low adoption, and strict reporting mandates creates significant friction for technology executives.
Cloud migration difficulties compound these software adoption issues. Storage architectures require optimization to handle high-velocity inputs. Poorly planned migrations generate unexpected monthly usage fees. Security monitoring requires automated data extraction. Manual evidence gathering fails to meet modern compliance deadlines.
Artificial intelligence introduces new interface capabilities for non-technical staff. Natural language queries replace traditional programming commands. This technology requires clean underlying databases to function accurately. The transition from descriptive reporting to automated task execution defines the current software development cycle.
Software budgets continue to increase across the corporate sector. The global business analytics software market reached $33.36 billion in 2024 [1]. Financial models project this figure will hit $88.44 billion by 2032. This expansion represents a 12.96% compound annual growth rate over the eight-year period. North American companies generate approximately 40% of this global revenue [1].
The specific subset of visual charting programs accounts for $12.24 billion of that total spending [2]. Demand for graphical data representation drives this targeted software expansion. Mid-market companies generate 79% more data annually than they did five years ago [3]. Information volume forces managers to buy visual interpretation tools. Raw spreadsheets cannot process billions of rows efficiently. Visual tools condense millions of transaction records into single trend lines.
Enterprise buyers view these purchases as operational necessities rather than experimental upgrades. Over 68% of surveyed executives cite enhanced decision-making capabilities as their primary reason for purchasing analytics licenses [3]. The United States market alone hit $5.5 billion in 2024 [4]. Despite these massive capital outlays, software buyers report high frustration levels regarding actual employee usage. Purchasing a license does not guarantee that employees will change their daily workflow habits.
Vendors advertise autonomous data access as a primary software benefit. Business leaders deploy these platforms expecting immediate productivity gains. User adoption rates tell a very different story. Gartner data shows that 90% of autonomous analytics initiatives lack necessary governance structures [5]. Only 20% of employees actively use the analytics tools available to them [5]. This creates a severe disconnect between software expenditure and operational value.
Employees abandon software interfaces when they cannot easily extract answers. Over 60% of business users feel overwhelmed by the steps required to generate a simple report. They revert to static spreadsheets. When deploying solutions aimed at enabling non-technical staff to build reports, IT departments frequently underestimate the required training time. Training sessions focus on button placement rather than data interpretation.
Data lakes exacerbate the adoption problem. Business units pull from different tables to calculate the exact same metric. The marketing department uses different conversion definitions than the sales department. When two departments present conflicting revenue numbers in a meeting, executive trust in the software evaporates. A recent study noted that 62% of project failures link directly to governance gaps rather than software bugs [6].
Modern visual analytics require scalable computing architectures. On-premises servers cannot process streaming inputs quickly enough. Moving these analytical workloads to cloud environments introduces severe fiscal risk. McKinsey reports that 75% of cloud transition projects exceed their budget [7]. Furthermore, 38% of these projects fall behind schedule by more than one full fiscal quarter [7].
Data transfer fees generate unexpected monthly bills. Organizations that stream all network traffic rather than filtering for specific events face budget crises. One retail organization streamed 50 gigabytes of unoptimized clickstream data per hour to its analytics platform. This created $18,000 in monthly streaming costs for information that mostly went unused. By implementing simple filtering rules, they reduced expenses by 80%. Organizations typically spend 20% to 30% more than their initial cloud budget estimates due to poor network planning [8].
The lift-and-shift approach causes most of these budget failures. Moving an outdated database directly to a cloud server without restructuring the architecture guarantees inefficiency. Cloud vendors charge by processing time and data volume. Inefficient queries that cost nothing on owned hardware suddenly generate massive daily invoices. Teams must rewrite calculation logic to match cloud pricing models before turning off their legacy servers.
Compliance mandates force companies to upgrade their monitoring systems. The US Securities and Exchange Commission enacted strict cybersecurity disclosure rules in 2023. Public companies must file a Form 8-K within four business days of identifying a material cyber incident [9]. The 96-hour countdown begins at the materiality determination, not the initial breach discovery [9]. This subtle legal distinction creates intense operational pressure.
This strict timeline requires automated audit logging. Manual evidence gathering takes too long. Companies need systems capable of presenting critical metrics to the board instantly. Annual 10-K filings must now detail the board's precise oversight mechanisms for cyber risks [10]. Providing directors with live security interfaces transforms this requirement from a legal exercise into a documented operational process.
Finance departments face overlapping disclosure demands. Teams responsible for visualizing financial statements must now integrate cyber risk exposure alongside standard revenue metrics. Assessing incident materiality requires dollar-value estimates of compromised records. Analysts must link network security alerts directly to expected revenue losses. Security teams and finance teams historically used completely separate reporting tools. The new SEC regulations force these departments to merge their data streams into unified oversight panels.
Failure to meet these reporting standards results in severe penalties. The SEC already fined Intercontinental Exchange $10 million for failing to report a cyber intrusion promptly. Regulators look specifically for evidence that executives attempted to hide breaches while determining financial impact. Live dashboards with unalterable timestamps provide the legal defense necessary to prove swift corporate action.
Batch processing no longer meets modern operational demands. Supply chain managers need live updates. The streaming analytics market will grow from $44.55 billion in 2025 to $146.72 billion by 2034 [11]. This represents a 12.52% compound annual growth rate [11]. Platforms like Apache Kafka and Amazon Kinesis manage high-velocity data inputs.
Latency issues plague poorly designed systems. Analyzing streaming data requires specialized engineering skills. Applications built for tracking operations data in real time must parse thousands of events per second. Machine learning models detect system anomalies as they occur [12]. E-commerce platforms monitor user clickstreams to adjust inventory pricing instantly. Manufacturing plants predict equipment failures by analyzing sensor readings before a machine breaks down.
Building these pipelines requires significant engineering overhead. Kafka functions as a data pump rather than an analytical engine. Teams must write secondary processing scripts to actually interpret the streaming information. Integrating these continuous streams into standard visualization platforms often causes browser crashes. Traditional charting software attempts to render every single data point. Modern tools must aggregate the stream into time-based intervals before pushing the visual update to the user's screen.
Software vendors actively embed natural language processing into their core products. Microsoft integrated conversational tools into its Fabric data platform. The company reported 48 million active monthly users for its Power Platform suite in 2024 [13]. Salesforce launched Tableau Pulse to automate insight generation for non-technical users [14]. These features allow analysts to type plain English questions instead of writing complex query statements.
Organizations deploy these tools to bypass standard reporting bottlenecks. A sales manager can ask why conversion rates dropped in a specific region. The software parses the text, scans the underlying tables, and renders an answer chart instantly. This process previously required a formal IT ticket and a two-week waiting period. Microsoft 365 Copilot usage now spans nearly 60% of Fortune 500 companies [13]. Employees use these assistants to summarize numerical data into readable text blocks.
These systems require perfect semantic models. If the database lacks clear column definitions, the AI will confidently display incorrect numbers. A conversational interface cannot guess whether a column labeled 'Rev_2' means gross revenue or net revenue. Technical teams must build logical models before turning on conversational features. Companies skipping this preparation phase experience rapid user abandonment. Trust disappears immediately when an AI generates a hallucinated financial metric.
Agentic workflows represent the next software iteration. Current platforms answer user questions passively. Future platforms will execute tasks based on those answers automatically. Gartner indicates that analytics platforms are transitioning from descriptive interfaces to prescriptive engines [15]. The software will identify a supply chain delay, alert the responsible manager, and automatically draft a rerouting proposal.
Cloud providers will continue consolidating smaller software vendors. Scale determines survival in the infrastructure market. Independent charting tools struggle to compete with native cloud integrations. Amazon, Google, and Microsoft offer visualization tools bundled securely within their cloud contracts. This bundling strategy lowers procurement friction for enterprise buyers. Standalone software companies must offer superior artificial intelligence features to justify their separate subscription fees.
User interfaces will shift entirely away from static grids. Audio briefings and interactive conversational streams will replace daily email attachments. The underlying mathematical calculations remain identical, but the delivery mechanism adapts to human preferences. Successful implementations will focus heavily on data quality pipelines rather than visual aesthetics. Organizations that master their internal data architecture will achieve high adoption rates.
| Year | Power BI (%) | Tableau (%) |
|---|---|---|
| 2021 | 5.4 | 13 |
| 2022 | 7.2 | 12.5 |
| 2024 | 13.7 | 16.4 |
| 2025 | 20.1 | 16.4 |
| 2026 | 22.5 | 17.8 |
This data illustrates the rapid acceleration of Microsoft Power BI's market share compared to its primary competitor, Tableau, between 2021 and 2026. While Tableau maintained an early lead as the industry standard for data visualization, Power BI's adoption surged from roughly 5.4% in 2021 to over 22% by 2026, establishing a new market hierarchy where Microsoft clearly leads [1].
On a micro level, this indicates that organizations are increasingly prioritizing cost-effective, easily integrated reporting tools over specialized, standalone visualization software. Power BI’s inclusion in the Office 365 ecosystem allows companies to scale their data analytics efficiently without expensive, separate licensing [2]. On a macro level, the business intelligence industry is moving away from "visualization-first" platforms toward unified, AI-augmented decision engines [3]. The strategic focus has shifted from creating aesthetically complex charts to enabling quick, self-service insights for non-technical business users through natural language processing and automated data preparation [4].
This power shift underscores a broader digital transformation where data literacy is being democratized across all levels of a company, rather than being siloed in IT or data science departments. By utilizing tools that non-technical staff already understand, organizations see up to 40% higher user adoption rates in platforms like Power BI compared to Tableau [4]. Consequently, businesses can make data-driven decisions significantly faster, moving from reactive historical reporting to proactive, real-time operational execution [5].
The primary catalyst for Power BI's explosive growth is Microsoft’s aggressive bundling strategy with Office 365 and Azure, which drastically lowers the barrier to entry and total cost of ownership [6]. Additionally, the recent boom in generative AI has allowed Microsoft to integrate Copilot directly into Power BI, enabling users to generate actionable reports simply by asking questions in plain English [7]. Tableau, while retaining unmatched depth in exploratory visual analytics, carries a steeper learning curve and a higher price tag that can be prohibitive for widespread enterprise deployments [8]. Finally, the shift toward remote and hybrid work likely accelerated the need for cloud-native, collaborative BI tools that integrate seamlessly into daily workflow platforms like Microsoft Teams [9].
The data definitively shows that the data visualization and reporting market has crowned a new leader driven by software ecosystem synergy and artificial intelligence capabilities. While Tableau remains the gold standard for dedicated data scientists requiring deep visual customization, Power BI has won the broader enterprise market through accessibility, affordability, and AI automation. The key takeaway for business leaders is that the future of business intelligence lies in embedded, frictionless analytics that live directly within the operational tools employees use every day.