

3..
| Year | Adoption Rate (%) |
|---|---|
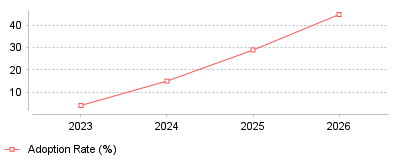
| 2023 | 4 |
| 2024 | 15 |
| 2025 | 29 |
| 2026 | 45 |
The provided data illustrates a dramatic surge in the adoption of Agentic AI within marketing workflows, leaping from just 4% of teams in 2023 to 45% in 2026 [1]. Concurrently, the marketing automation industry has seen consistent, robust financial growth, scaling from $6.65 billion in 2024 to over $8 billion in 2026 [2], [3].
On a micro level, individual marketing professionals are shifting away from manually building static "if-this-then-that" email drip campaigns [4]. Instead, they are deploying autonomous systems that can dynamically route leads, automatically perform quality assurance on campaigns, generate content variants, and personalize messaging at scale [1]. On a macro industry level, this represents an architectural evolution where platforms act less like passive tools and more like autonomous operators making real-time decisions [5]. Vendors across the market, from enterprise CRMs to mid-market tools, are aggressively consolidating their offerings around these agent-first capabilities to capture soaring demand [1]. Consequently, businesses relying solely on legacy, volume-based strategies risk falling permanently behind competitors equipped with intelligent, goal-oriented systems.
This trend is critical because the efficiency and profitability of automated lead nurturing now far eclipse traditional batch-and-blast methods. Organizations running intelligent, AI-assisted workflows report an MQL-to-SQL (Marketing Qualified Lead to Sales Qualified Lead) conversion rate that is 30% to 50% higher than standard tactics [1]. Furthermore, enterprise deployments of these agentic AI systems are yielding an average ROI of 171%, with organizations seeing significantly faster campaign build times and reduced acquisition costs [5], [1]. Ultimately, adapting to this technology is transitioning from being an experimental advantage to an absolute operational necessity for survival in modern digital commerce.
The explosion of generative AI models, such as ChatGPT and Claude, heavily democratized complex machine learning capabilities, paving the way for specialized agents tailored specifically to B2B and B2C marketing funnels [6]. Additionally, changing consumer expectations mean buyers now demand highly personalized, real-time, omnichannel interactions, which human teams simply cannot sustain manually at scale [7]. The ongoing push for "doing more with less" in challenging macroeconomic climates has also incentivized executives to invest heavily in software that promises a proven $5.44 return for every single dollar spent [2]. Finally, as major platform vendors launched native agent capabilities out-of-the-box, the barrier to entry was drastically lowered, triggering mass adoption across small and large enterprises alike [1].
The landscape of drip campaigns and lead nurturing tools has irreversibly shifted toward AI-driven autonomy, reshaping both daily marketing workflows and macro corporate budgets. As adoption rates soar and market valuations climb toward the $10 billion mark over the coming years, organizations are realizing rapid, tangible financial returns. The most prominent takeaway is that adopting Agentic AI in marketing is no longer just a futuristic concept; it is the current, dominant reality required to maintain a competitive and highly profitable sales pipeline.
Global spending on marketing technology reached $148 billion in 2024 [1]. Within that total, automation applications represent a lucrative category. The automation sector generated $6.65 billion in revenue during 2024 [2]. Analysts project this vertical will reach $15.58 billion by 2030, reflecting a 15.3% compound growth rate [3]. Email operations continue to dominate this space, accounting for 26.7% of category revenue [4]. Cloud-based deployments hold 82.14% of the market share [5]. Small enterprises account for 62.88% of these software installations [6]. Retail organizations represent the largest buyer segment, commanding 22.49% of industry software purchases [7].
Organizations purchase software for marketing and advertising to coordinate buyer interactions across digital channels. System administrators face operational hurdles as platform complexity increases. Stricter privacy controls and strict filtering rules force teams to abandon legacy tactics. Platform operators can no longer send unauthenticated messages. They can no longer calculate campaign success using pixel tracking. Administrators must configure automated sequencing tools to respect technical boundaries while relying on predictive analytics for engagement scoring.
Software vendors face an incredibly crowded marketplace. The technology sector contains 15,384 distinct applications for digital promotion [8]. This represents a massive increase from the 150 tools available in 2011 [9]. Market saturation creates integration problems for technology buyers. Chief Information Officers struggle to synchronize behavioral data across disparate applications. Customer relationship platforms now lead software deployments at 72%, finishing ahead of advertising tools at 61% and data applications at 54% [10]. Large enterprises represent 70.5% of total software adoption due to operational complexity [11]. Precedence Research calculates the total software size at $9.80 billion in 2025, climbing to $36.97 billion by 2035 [12].
Klaviyo reported $937.5 million in revenue for its 2024 fiscal year [13]. This represents a 34.3% increase from the prior period [14]. The vendor reduced its annual loss to $46.1 million, demonstrating improved cost controls following its public offering [15]. Sales expanded globally throughout the year. International transactions accounted for 32.6% of the company total [16]. The application currently supports 167,000 customer accounts [17]. Online retailers rely heavily on trigger-based communication for online stores to recover abandoned carts and drive repeat purchases. This specific vendor recorded a 108% revenue retention rate during the fourth quarter [18].
HubSpot demonstrated similar financial momentum during the same timeframe. The company generated $617.4 million in the first quarter of 2024 [19]. Subscription revenue accounted for $603.8 million of that total [20]. Operating margins reached 15%, reflecting deliberate margin strategies [21]. Platform accounts reached 216,840 by March 2024 [22]. Average subscription revenue per customer remained stable at $11,400 [23]. The firm directed $175.64 million toward research efforts during that three-month period [24]. The company holds $1.8 billion in cash reserves, providing massive capital for future acquisitions [25]. Management confirmed that 90% of their base migrated to a new pricing model that removes seat minimums [26].
Public market figures reveal distinct consumption patterns among software buyers. Enterprise buyers consolidate their technology purchases. Standalone messaging utilities struggle to compete against unified suites. Administrators prefer single databases. Connecting third-party plugins causes synchronization errors that damage customer experiences. Organizations deploying follow-up systems built into customer databases bypass expensive middleware contracts entirely. Vendors face margin pressure as customers demand outcome-based pricing rather than traditional seat licenses.

Google and Yahoo enacted strict sender regulations in February 2024. Organizations transmitting more than 5,000 messages daily face mandatory technical requirements [27]. Administrators must configure Domain-based Message Authentication protocols [28]. They must deploy Sender Policy Framework records. They must install DomainKeys Identified Mail signatures. Outbound mail servers must use encryption standards. Unauthenticated messages encounter immediate server rejection.
Complaint limits represent the most difficult operational hurdle. Senders must maintain spam report rates below 0.3% [29]. Generating just one complaint per thousand messages produces a 0.1% spam rate [30]. Exceeding this boundary causes sustained reputation damage. Inbox providers route subsequent campaigns automatically to spam folders. Administrators must implement one-click unsubscribe links in message headers to comply with Request for Comments 8058 specifications [31]. Senders must honor unsubscription requests within two days [32].
Industry surveys indicate that 49.5% of corporate senders made immediate changes to their communication programs following the announcement [33]. Approximately 80% of those operators updated authentication practices, while 33.1% added specific header links [34]. Furthermore, 35.8% increased list hygiene efforts to remove inactive accounts [35]. Operators who ignored the February updates experienced deliverability drops between 30% and 50% [36].
Small operators often assume these rules only apply to enterprise corporations. This assumption creates business risk. Accounts sending fewer than 5,000 messages still face severe penalties for missing technical records [37]. Providers place non-compliant senders into manual review tracks. Modern teams must construct visual sequence builders that monitor server feedback loops constantly. Software must pause communication automatically when complaint volumes approach critical limits.
Artificial engagement signals distort performance dashboards across the software industry. Apple released Mail Privacy Protection for device users in September 2021 [38]. The protocol routes message content through proxy servers. It obscures IP addresses and location data [39]. The software downloads tracking pixels automatically upon delivery. This proxy behavior registers false engagement events inside vendor analytics panels.
Device mechanisms operate silently in the background. Apple downloads all message images before the human recipient views the text [40]. The sender records a positive signal even if the user deletes the thread immediately. The system masks geographic details including country, city, and time zone [26]. This privacy protection affects between 25% and 40% of all global emails [41]. Open rates climbed by 9 percentage points globally during the year following the initial update [42].
Current adoption rates exacerbate the reporting problem. Approximately 85% to 90% of eligible device owners currently enable the protection feature [43]. Accounts that historically recorded 20% engagement suddenly display 50% metrics despite stagnant conversion volumes [44]. A campaign might show a 55% open rate while true human interaction rests at 15% [5]. This dynamic causes click-to-open rates to plummet artificially [45]. Because the denominator inflates dramatically, historical ratio benchmarks become useless.
Revenue leaders cannot formulate financial strategy based on pixel fires. They track absolute click volumes. They monitor reply ratios. They measure pipeline dollars directly attributed to specific digital assets. Modern systems evaluate performance by measuring verified website sessions generated per message sent. Administrators who trigger automated replies based on false open signals alienate active buyers.
Salesforce deployed Agentforce in late 2024 to execute tasks autonomously [46]. The product handled 380,000 internal support interactions and resolved 84% of those cases without human intervention [47]. Artificial intelligence models now perform between 30% and 50% of internal work at the company [48]. The vendor projects full-year fiscal 2025 revenue between $37.8 billion and $38 billion [49].
Independent software agents represent the primary growth catalyst for marketing technology. Industry surveys show 27% of professionals expect autonomous workflows to generate the highest operational impact over the coming years [50]. Teams replace static decision trees with goal-oriented algorithms. Administrators define campaign objectives and allow software models to select transmission times. Platforms synthesize unstructured data from previous client interactions. The software drafts personalized subject lines for individual prospects automatically. The vendor acquired Zoomin to manage unstructured data, ensuring agents deliver context-aware responses [51].
Performance data supports this rapid technological transition. According to internal analysis by Salesforce, 83% of sales teams using artificial intelligence recorded revenue growth during the past year [52]. Conversely, only 66% of teams without artificial intelligence achieved similar growth [53]. Furthermore, 92% of service divisions credit the technology with reducing operational costs [9]. Consumers estimate they are transferred at least once during 87% of service interactions, driving the need for instant resolution capabilities [54].
Pricing structures shift entirely under this model. Vendors transition from volume-based seat licenses to outcome-based contracts. Buyers pay for completed autonomous tasks rather than database capacity. Executives expect these tools to eliminate manual scheduling tasks entirely by 2026. This allows employees to focus purely on complex contract negotiations.
Companies operating structured communication programs generate 50% more sales-ready prospects [55]. Furthermore, these organizations lower their cost per acquisition by 33% [56]. Static contact lists fail to convert modern buyers. Business prospects demand contextually relevant material delivered according to precise schedules. Research from SiriusDecisions indicates that nurtured accounts produce a 20% increase in sales opportunities compared to ignored prospects [57]. Forrester research indicates that companies executing personalized omnichannel sequences using artificial intelligence achieve a 40% higher conversion rate .
System administrators face severe integration barriers. Connecting independent point solutions creates latency. When synchronization processes fail, sequencing software transmits irrelevant promotional offers to existing customers. This technical friction drives enterprise buyers toward unified database models. Centralized applications process behavioral signals instantly. Rapid processing prevents conflicting messages from reaching targeted accounts. Higher customer lifetime value makes a buyer more valuable to the business because they generate more revenue and remain loyal .
Data architecture dictates operational success. Analysts expect worldwide spending on customer data management tools to surpass $215 billion by 2027 . Companies require exact synchronization between their advertising platforms and their communication queues. Dynamic scoring algorithms evaluate intent signals constantly. They measure website behavior, job changes, and review site visits to calculate purchase readiness . Teams route high-scoring accounts to human representatives while returning low-scoring accounts to automated sequences.
Privacy frameworks will increase technical demands on software vendors. Small businesses will abandon self-hosted servers. They will migrate toward managed infrastructure to ensure inbox placement. Product leaders will embed predictive models directly into interface dashboards to offset the loss of pixel tracking. Capital allocation will favor platforms offering native payment gateways and centralized data lakes. Communication providers capture market share by proving their infrastructure reliability. Twilio achieved operating profitability for the first time in the fourth quarter of 2024, demonstrating the financial viability of strict efficiency measures .
Application developers extract additional revenue by embedding transaction processing within messaging software. HubSpot Payments processes transactions natively while charging a platform fee ranging from 0.5% to 0.75% . This fee applies alongside standard processing rates. Platforms that capture total customer spend reduce software churn significantly. High switching costs associated with migrating operational data lock in vendor revenue . The shift toward agentic software justifies this expanded spending.
Executives scrutinize software investments closely as marketing budgets remain constrained. Organizations spent 18% of their total marketing budgets on technology in 2023 . Two-thirds of business leaders plan to increase that allocation . By automating routine follow-up tasks, companies redirect employee hours toward strategic account planning and complex contract negotiations. Cloud subscriptions now command 66.3% of tech budgets, proving that businesses prefer managed infrastructure over isolated point solutions .
3..
| Year | Adoption Rate (%) |
|---|---|
| 2023 | 4 |
| 2024 | 15 |
| 2025 | 29 |
| 2026 | 45 |
The provided data illustrates a dramatic surge in the adoption of Agentic AI within marketing workflows, leaping from just 4% of teams in 2023 to 45% in 2026 [1]. Concurrently, the marketing automation industry has seen consistent, robust financial growth, scaling from $6.65 billion in 2024 to over $8 billion in 2026 [2], [3].
On a micro level, individual marketing professionals are shifting away from manually building static "if-this-then-that" email drip campaigns [4]. Instead, they are deploying autonomous systems that can dynamically route leads, automatically perform quality assurance on campaigns, generate content variants, and personalize messaging at scale [1]. On a macro industry level, this represents an architectural evolution where platforms act less like passive tools and more like autonomous operators making real-time decisions [5]. Vendors across the market, from enterprise CRMs to mid-market tools, are aggressively consolidating their offerings around these agent-first capabilities to capture soaring demand [1]. Consequently, businesses relying solely on legacy, volume-based strategies risk falling permanently behind competitors equipped with intelligent, goal-oriented systems.
This trend is critical because the efficiency and profitability of automated lead nurturing now far eclipse traditional batch-and-blast methods. Organizations running intelligent, AI-assisted workflows report an MQL-to-SQL (Marketing Qualified Lead to Sales Qualified Lead) conversion rate that is 30% to 50% higher than standard tactics [1]. Furthermore, enterprise deployments of these agentic AI systems are yielding an average ROI of 171%, with organizations seeing significantly faster campaign build times and reduced acquisition costs [5], [1]. Ultimately, adapting to this technology is transitioning from being an experimental advantage to an absolute operational necessity for survival in modern digital commerce.
The explosion of generative AI models, such as ChatGPT and Claude, heavily democratized complex machine learning capabilities, paving the way for specialized agents tailored specifically to B2B and B2C marketing funnels [6]. Additionally, changing consumer expectations mean buyers now demand highly personalized, real-time, omnichannel interactions, which human teams simply cannot sustain manually at scale [7]. The ongoing push for "doing more with less" in challenging macroeconomic climates has also incentivized executives to invest heavily in software that promises a proven $5.44 return for every single dollar spent [2]. Finally, as major platform vendors launched native agent capabilities out-of-the-box, the barrier to entry was drastically lowered, triggering mass adoption across small and large enterprises alike [1].
The landscape of drip campaigns and lead nurturing tools has irreversibly shifted toward AI-driven autonomy, reshaping both daily marketing workflows and macro corporate budgets. As adoption rates soar and market valuations climb toward the $10 billion mark over the coming years, organizations are realizing rapid, tangible financial returns. The most prominent takeaway is that adopting Agentic AI in marketing is no longer just a futuristic concept; it is the current, dominant reality required to maintain a competitive and highly profitable sales pipeline.