

| Year | Global Average (%) | Email Average (%) |
|---|---|---|
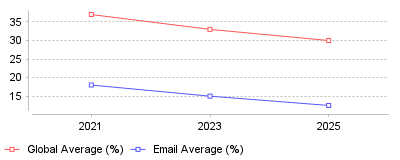
| 2021 | 37 | 18 |
| 2023 | 33 | 15 |
| 2025 | 30 | 12.5 |
This trend demonstrates a continuous, multi-year decline in the percentage of customers willing to complete feedback surveys, particularly through traditional email channels. While global average response rates hovered around 40% in 2019, they dropped to 33% in 2023, and email-specific response rates have been halved to just 10-15% by 2025 [source].
On a micro level, this decline means customer experience (CX) teams are working with increasingly skewed and unrepresentative datasets. As response volumes shrink, non-respondents skew disproportionately toward passive customers and mild detractors, which systematically and artificially inflates Net Promoter Scores (NPS) [source]. A company might celebrate a rising NPS while entirely missing the reality that their actual customer base is growing less satisfied but choosing to remain silent. On a macro industry level, this shift signals the end of the traditional email survey era, forcing feedback platforms to pivot toward in-app, SMS, and AI-driven conversational analytics to capture sentiment [source].
This trend is critically important because billions of dollars in enterprise resources, product roadmaps, and executive bonuses are tied to CX metrics like NPS and CSAT. If the underlying data relies on a tiny, biased fraction of hyper-engaged advocates—often falling below a 5% response rate in some B2C sectors—the insights become fundamentally unreliable [source]. Organizations risk making poor strategic decisions, misallocating budgets, and failing to address hidden churn risks because their primary feedback mechanism is broken.
The primary driver of this collapse is digital fatigue compounded by skyrocketing survey volumes. For instance, Retently noted a 44% drop in response rates in Q4 2025 simply because brands doubled their survey volume during the holidays [source]. Additionally, email inbox saturation has intensified as providers like and Apple use AI to automatically filter surveys into secondary tabs, drastically reducing visibility [source]. There is also a pervasive sense of futility among consumers, with 40% of customers citing that "nothing happened last time" as their main reason for ignoring new NPS requests [source].
The era of relying solely on post-interaction email surveys to measure customer sentiment is rapidly coming to a close due to plummeting engagement. To survive this data crisis, customer feedback platforms must integrate multi-channel approaches—such as SMS and contextual in-app prompts—while leveraging AI to analyze passive behavioral signals [source]. The most prominent takeaway is that higher NPS scores no longer guarantee higher satisfaction if the response rate is simultaneously collapsing; CX leaders must treat response rates as a vital quality metric, not just an operational afterthought.
Thoma Bravo surrendered control of Medallia to its lenders in April 2026, erasing $5.1 billion in private equity capital [1]. The buyout firm originally took the software developer private for $6.4 billion in 2021. Market conditions shifted rapidly. Medallia accumulated $3 billion in debt held by Blackstone, KKR, Apollo Global, and Antares Capital [1]. Underwriters calculated the initial loan terms using annual recurring revenue metrics instead of standard earnings [2]. The company generated $200 million in annual earnings against debt service costs that ballooned to $300 million [2]. Management relied on a payment-in-kind provision to defer cash interest by adding it to the principal balance. When the lead creditor refused to extend this relief, restructuring became the only option.
Competitors navigated similar macroeconomic pressures through different capitalization strategies. Silver Lake and CPP Investments acquired Qualtrics for $12.5 billion in 2023 [3]. Prior to the acquisition, Qualtrics reported 2022 total revenue of $1.45 billion, representing a 36% year-over-year increase [4]. Subscription revenue accounted for $1.22 billion of that total [4]. Fitch Ratings estimates Qualtrics operates with gross retention near 90% and net retention consistently exceeding 110% [5]. The firm serves 19,000 customers without significant client concentration [5].
Debt structures determine survival in this sector. Platforms built on zero-interest borrowing models face immediate cash flow crises when attempting to refinance. Market multiples for mature software-as-a-service vendors dropped from 9x revenue in 2021 to roughly 6x revenue in 2026. This contraction forces software executives to pivot from aggressive customer acquisition toward immediate profitability. Vendors achieve this by cross-selling modules to existing accounts. They integrate dedicated sentiment software into daily operational workflows to prove immediate return on investment to chief financial officers.
Market forecasters project continued expansion despite these financing challenges. Global voice of customer revenue reached $21.15 billion in 2024 [6]. Analysts expect this category to reach $62.59 billion by 2032, expanding at a 14.77% compound annual growth rate [6]. The specific software segment generated $13.35 billion in 2024, with large enterprises claiming over 51% of the revenue share [6]. Another analysis valued the specialized feedback software market at $2.5 billion in 2023, projecting a climb to $6.9 billion by 2032 [7]. The Asia Pacific region leads adoption velocity with a projected 15% growth rate [7].
Participation rates collapsed across all major distribution channels between 2019 and 2025. Email survey response rates declined from an average of 20% to just 10% [8]. Telecommunications and financial services companies that previously achieved 30% participation now struggle to reach 12% [8]. SurveySparrow noted that many organizations saw response rates drop from 30% to 18% in a six-month window [9]. Average completion rates sit at 33%, and they drop below 15% when questionnaires require more than five minutes to finish [10].
Buyers suffer from chronic evaluation fatigue. The average consumer receives up to five feedback requests weekly [8]. This barrage triggers three distinct operational failures. Pre-survey fatigue occurs when individuals delete invitations upon reading the time requirement. Mid-survey fatigue manifests when respondents rush through questions, skip open-ended text fields, or abandon the form entirely. Post-survey fatigue develops when users realize their previous submissions resulted in zero material changes to the product.
McKinsey reviewed 20 academic studies to isolate the root cause of this abandonment. Their analysis confirmed that the primary driver of survey fatigue is the perception that management will ignore the results [11]. Respondents break the feedback loop when they fail to see any correlation between their input and product improvements. Slack solved this by sending specific emails highlighting features built directly from user suggestions. This transparency increased their subsequent survey participation rates by 26% [10].
Organizations must monitor cognitive and behavioral indicators to diagnose questionnaire failure. Cognitive indicators include straight-lining, where users select the same option repeatedly on Likert scales to reduce mental processing demands. Behavioral indicators include rising break-off rates and completion times that fall drastically below historical baselines. When 70% of individuals quit forms due to sheer exhaustion, the resulting data becomes mathematically useless [9].

Low participation destroys mathematical validity. When response rates drop into the single digits, the remaining sample consists exclusively of vocal outliers. Extremely satisfied users return positive scores. Furious detractors leave negative reviews. The silent majority ignores the prompt entirely. This nonresponse bias skews the resulting Net Promoter Score and misleads executive teams.
A rising score does not guarantee product improvement. If an organization surveys 10,000 customers and 2,400 respond, they might generate a score of 38. If the following year only 1,400 respond and the score rises to 44, the improvement is an illusion [8]. The company lost 1,000 participants who likely abandoned the process due to mild dissatisfaction. Executives celebrating the higher score fail to realize their actual customer base grew more frustrated.
Formal analysis programs yield measurable financial outcomes when executed correctly. Gartner research from 2025 shows that companies operating formal feedback programs achieve 23% higher customer retention than their peers [12]. These organizations resolve customer problems 15% faster and reduce acquisition costs by up to 16% [12]. To achieve these metrics, administrators must segment audiences based on product usage patterns. Surveying inactive users generates outdated feedback, while bombarding power users creates immediate friction.
Account managers increasingly log these interactions directly into client retention databases to track renewal health. When a high-value account submits a detractor rating, automation rules trigger immediate alerts. Customer support agents route these urgent cases through unified ticketing systems to intercept the user before they cancel their contract. The value of the score lies entirely in the speed of the follow-up.
European privacy mandates forced vendors to rewrite their storage architectures. The General Data Protection Regulation requires explicit consent for data collection and restricts usage to specific purposes. Pre-checked boxes and assumed consent are illegal. Regulators penalize violations with fines reaching €20 million or 4% of global annual revenue [13]. The California Consumer Privacy Act imposes penalties of $7,500 per willful violation [14].
Organizations fail compliance audits because they refuse to delete historical records. Indefinite storage of text feedback violates both European and California law [15]. Customers possess the absolute right to request data deletion. To comply, software vendors must execute data mapping exercises to locate every instance of a user's information across distributed server clusters [14]. Deleting an account profile is simple; purging anonymized text comments that contain personally identifiable information requires dedicated engineering resources.
Artificial intelligence introduces severe compliance vulnerabilities. When a sentiment model processes raw feedback, it generates secondary insights. If the algorithm retains identifiable information in its output, the company faces legal exposure [15]. Retention rules must govern both the raw inputs and the machine-generated outputs. Administrators must prove they can automate deletion workflows across all storage systems upon request.
Liability remains with the enterprise regardless of vendor certifications. A technology provider might hold ISO 27001 or SOC 2 compliance documentation, but regulatory agencies prosecute the data controller. If an internal misconfiguration exposes European customer data on a foreign server, the purchasing organization pays the fine. Every additional year that an IT department stores archived responses increases the probability of a data breach or compliance failure.
Survey delivery methods dictate engagement success. Long-form emails with external links generate the lowest returns. Embedding the first question directly inside the email body increases participation slightly, yielding rates between 15% and 25% [16]. When users must click a hyperlink to load a separate webpage, engagement drops to between 6% and 15% [16]. Friction kills conversion at every step.
Mobile delivery systems outperform traditional channels. SMS messages achieve response rates between 40% and 50% [16]. In-app mobile intercepts generate responses from 20% to 35% of targeted users [16]. These formats force product managers to ask a single question rather than twenty. A hotel chain abandoned its 10-question checkout form in favor of a single recommendation score. Their completion rate immediately jumped from 18% to 41% [10].
Timing determines data quality. Interrupting a user workflow with a modal popup generates frustration. Triggering a micro-interaction immediately after a user completes a specific task captures accurate sentiment. One software provider sent an email questionnaire three days after account creation and received a 12% response [10]. When they shifted the prompt to appear contextually within the application directly after a successful action, participation spiked to 54% [10].
Contextual targeting identifies operational flaws that generic metrics miss. An online retailer triggered specific prompts only when users executed multiple consecutive searches without clicking a product. This behavioral targeting revealed that 72% of these users found the category filters broken [10]. Standard satisfaction forms sent a week later would never capture this specific technical failure.
Vendors abandoned lengthy questionnaires in favor of behavioral analysis. The industry shifts away from asking users how they feel toward measuring what they actually do. Modern platforms ingest unstructured data from support transcripts, chat logs, and public reviews. Over 80% of consumer feedback exists in these unstructured formats. Legacy systems reduce this text to basic keywords, destroying the underlying emotional context.
Natural language processing models categorize emotion, urgency, and root causes without manual tagging. This automation enables real-time prioritization. When a shipping failure spikes in online reviews, the algorithm detects the anomaly before human agents compile their weekly reports. A retail company used sentiment extraction to identify a logistics error within 48 hours, resulting in a 12% reduction in overall return rates [12].
Predictive modeling replaces manual collection entirely. Artificial intelligence algorithms analyze product usage depth, support ticket volume, and contract value changes to forecast satisfaction scores before sending a single email. If a user logs in daily but files three bug reports in a week, the model classifies them as a churn risk. The software bypasses the survey stage entirely and alerts the renewal team to intervene.
Operations teams use these insights to close the loop automatically. When the algorithm predicts a promoter classification, it triggers an automated request for a public review. When it identifies a passive user, it sends targeted educational content regarding unused features. Human intervention focuses exclusively on detractors with high contract values. This triage system maximizes employee bandwidth while respecting the consumer's time.
| Year | Global Average (%) | Email Average (%) |
|---|---|---|
| 2021 | 37 | 18 |
| 2023 | 33 | 15 |
| 2025 | 30 | 12.5 |
This trend demonstrates a continuous, multi-year decline in the percentage of customers willing to complete feedback surveys, particularly through traditional email channels. While global average response rates hovered around 40% in 2019, they dropped to 33% in 2023, and email-specific response rates have been halved to just 10-15% by 2025 [source].
On a micro level, this decline means customer experience (CX) teams are working with increasingly skewed and unrepresentative datasets. As response volumes shrink, non-respondents skew disproportionately toward passive customers and mild detractors, which systematically and artificially inflates Net Promoter Scores (NPS) [source]. A company might celebrate a rising NPS while entirely missing the reality that their actual customer base is growing less satisfied but choosing to remain silent. On a macro industry level, this shift signals the end of the traditional email survey era, forcing feedback platforms to pivot toward in-app, SMS, and AI-driven conversational analytics to capture sentiment [source].
This trend is critically important because billions of dollars in enterprise resources, product roadmaps, and executive bonuses are tied to CX metrics like NPS and CSAT. If the underlying data relies on a tiny, biased fraction of hyper-engaged advocates—often falling below a 5% response rate in some B2C sectors—the insights become fundamentally unreliable [source]. Organizations risk making poor strategic decisions, misallocating budgets, and failing to address hidden churn risks because their primary feedback mechanism is broken.
The primary driver of this collapse is digital fatigue compounded by skyrocketing survey volumes. For instance, Retently noted a 44% drop in response rates in Q4 2025 simply because brands doubled their survey volume during the holidays [source]. Additionally, email inbox saturation has intensified as providers like and Apple use AI to automatically filter surveys into secondary tabs, drastically reducing visibility [source]. There is also a pervasive sense of futility among consumers, with 40% of customers citing that "nothing happened last time" as their main reason for ignoring new NPS requests [source].
The era of relying solely on post-interaction email surveys to measure customer sentiment is rapidly coming to a close due to plummeting engagement. To survive this data crisis, customer feedback platforms must integrate multi-channel approaches—such as SMS and contextual in-app prompts—while leveraging AI to analyze passive behavioral signals [source]. The most prominent takeaway is that higher NPS scores no longer guarantee higher satisfaction if the response rate is simultaneously collapsing; CX leaders must treat response rates as a vital quality metric, not just an operational afterthought.