

| Year | Market Size (USD Billions) |
|---|---|
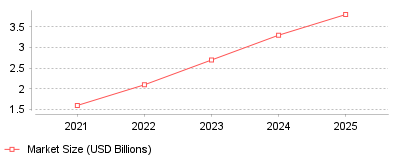
| 2021 | 1.6 |
| 2022 | 2.1 |
| 2023 | 2.7 |
| 2024 | 3.3 |
| 2025 | 3.8 |
This trend demonstrates a rapid expansion in both the broader product launch software market and the highly specialized B2B buyer intent data sector. Between 2021 and 2025, the intent data market more than doubled, reaching an estimated 3.8 billion dollars as modern revenue teams increasingly reject static lead generation methods. [1]
At a micro level, individual Go-to-Market teams are shifting their budgets away from generic contact databases and pouring them into real-time signal tracking systems. Instead of simply buying lists of emails, companies are investing in tools that alert them the exact moment a prospect reads a competitor's pricing page or searches for a related solution. [2] On a macro industry scale, this signals a consolidation and maturation of the GTM software stack, where product launch success is no longer dictated by the volume of outreach, but by the precise timing of engagement. The projected growth of these platforms suggests that intent data will soon become table stakes for any competitive B2B product launch. [3]
This transformation is critically important because traditional product launch and marketing playbooks are yielding increasingly lower conversion rates. Engaging with prospects solely based on their firmographics or job titles wastes valuable sales resources on buyers who are not actively in the market. [4] By leveraging buyer intent software, organizations can dramatically shorten their sales cycles, increase their pipeline return on investment, and align their marketing, sales, and product teams around actual behavioral data rather than guesswork.
The catalyst for this shift is likely a combination of AI advancements and severe buyer fatigue. Business decision-makers are inundated with automated, cold outreach, rendering generic product launch campaigns highly ineffective. At the same time, machine learning algorithms have become sophisticated enough to process millions of passive behavioral signals—such as web traffic, content downloads, and forum discussions—and translate them into actionable, account-level intent scores. Furthermore, tightening economic conditions over the past few years have forced revenue leaders to scrutinize their technology budgets, favoring tools that offer clear, predictive indicators of revenue generation over vanity metrics. [5]
The integration of buyer intent data into product launch and GTM planning software marks a permanent evolution in how companies go to market. The days of "spray and pray" product launches are being rapidly replaced by surgically precise, intent-driven engagements. The most prominent takeaway is that future GTM success will belong to organizations that can operationalize real-time buyer signals faster than their competitors.
Enterprise technology spending will reach $5.74 trillion in 2025, representing a 9.3% annual increase [1]. Software purchases command a massive portion of this capital. Software budgets will grow 14% to $1.23 trillion during the same period [1]. Forrester projects commercial software spending will ultimately reach $1.7 trillion by 2029, maintaining a steady compound annual growth rate of 9.5% for application software [2]. Business-to-business software transactions reached $974 billion in 2023 [3]. Cloud-based go-to-market applications capture approximately 1.5% to 2% of this spending pool [3].
Organizations continue to fund these tools despite macroeconomic headwinds. The global business sector initiated a strategic pause on net-new technology spending during the second quarter of 2025 [4]. Finance leaders scrutinize software contracts aggressively to protect profit margins. Buyers consolidate functionality to eliminate redundant applications and negotiate fiercely against price increases [2]. Sixty-one percent of enterprises began 2025 in a stronger position than the previous year, yet only 24% expect to end the year ahead of their financial plans [4].
Regional growth metrics reflect this sustained investment. Asia Pacific technology spending will grow 5.7%, driven largely by export services in India and the Philippines [5]. North America will expand by 5.4%, with software capturing 60% of regional budgets by 2027 [5]. Europe will see a 5.1% increase as the continent recovers from previous economic contraction [5]. These expanding budgets indicate that corporate leadership views software infrastructure as a mandatory operational requirement.
Product delays destroy revenue opportunities instantly. Forty-five percent of product launches miss their scheduled release dates by at least one month [6]. These scheduling failures cause severe consequences. Twenty percent of delayed launches completely miss their internal revenue targets [6]. Only 11% of organizations report that all their products meet defined internal targets [6]. In total, 95% of new products fail each year [7].
Startups experience launch failure rates between 60% and 80% [8]. Established corporations perform slightly better, recording failure rates between 30% and 40% [8]. Software buyers evaluate product launch and GTM planning tools to mitigate these risks. These systems track the specific factors that derail product introductions before they reach the public market.
Absence of formal launch processes ranks among the primary causes for these delays [9]. Product bugs, feature creep, and poor quality control compound the problem [9]. Analysts note that delays deny businesses the opportunity to capture peak market demand. Competitors use these delays to pitch alternative solutions, effectively stealing potential clients before the delayed product ever reaches the market [10]. A simple one-month delay on a product generating $10,000 weekly results in an immediate $40,000 revenue loss, excluding the permanent damage to lifetime customer value [10].
Market research confirms the value of concept testing to prevent these outright failures. Thirty-five percent of product failures stem directly from misunderstanding customer needs [8]. Another 30% fail because they do not solve a meaningful problem [8]. Concept testing provides evidence to refine an idea before major capital investment begins [11]. Product teams use this data to secure investor confidence and replace trial-and-error development with targeted execution.

Adding more meetings to a launch schedule actively decreases cross-departmental efficiency. Datasite eliminated 4,000 meetings over a five-month period by implementing video tools alongside formal task trackers [12]. The merger software provider saved half a million dollars in employee time [12]. Workers submit recorded video updates rather than gathering for synchronous progress checks.
Poor internal alignment causes 56% of product launch failures [13]. Product managers operate in isolation while marketing departments prepare promotional materials blindly. Forrester research reveals that 60% to 70% of B2B marketing content goes unused by sales representatives [14]. Sellers ignore expensive data sheets and battle cards because the materials lack practical customer relevance [14]. In fact, 79% of marketing-generated leads never convert into finalized sales [15].
Corporate profitability directly correlates with departmental synchronization. Aligned organizations achieve 24% faster three-year revenue growth [15]. These synchronized companies are 72% more profitable than their disjointed competitors [15]. Businesses that tightly align their sales and marketing operations achieve 38% higher win rates [16]. Sales representatives in misaligned companies spend a mere 33% of their daily schedules actively selling to prospects [15].
Operations transformations that span multiple departments consistently outperform single-function initiatives by 30% to 40% [17]. Product marketing teams must connect their planning software to engineering repositories. Marketers need immediate visibility when developers push a code release back by two weeks. When critical handoffs fail, 25% to 35% of development requires extensive rework [18].
Smartsheet surpassed $1 billion in annualized recurring revenue during the fourth quarter of its 2024 fiscal year [19]. The company reported total annual revenue of $958.3 million, marking a 25% increase over the previous year [20]. Large clients drive this financial expansion. Customers spending over $100,000 annually grew by 28% year-over-year, representing 53% of Smartsheet's total recurring revenue [21]. The vendor now supports a base of 14 million users globally [22].
Executives demand centralized project management and productivity tools to eliminate disconnected point solutions. Software vendors respond by absorbing specialized launch functions into their core platforms. Smartsheet recently promoted Praerit Garg to President of Product to accelerate this enterprise feature development [23]. The company repurchased 1.1 million shares for $50 million during the first nine months of fiscal 2025, demonstrating strong capital liquidity [24].
Asana reported comparable enterprise momentum. The company grew its revenue by 14% year-over-year in the fourth quarter of fiscal 2024 [25]. Subscriptions from clients spending more than $100,000 annually grew 29% during the fiscal year [25]. The vendor maintained a 115% net retention rate among these large organizations [26]. To capture additional executive budget, Asana launched premium editions featuring advanced security controls and increased automation limits [27].
Atlassian aggressively targets product managers to bridge the gap between engineering and marketing. The vendor released Jira Product Discovery into general availability in May 2023 [28]. Within nine months, the module acquired over 4,000 paying customers [29]. Organizations deploy these launch planning tools for cross functional teams to capture feature ideas and align them with corporate strategy. By integrating discovery directly into the core Jira architecture, Atlassian prevents product teams from adopting disjointed third-party applications. This platform strategy proves lucrative. The Atlassian Marketplace generated over $1.1 billion in gross purchases during fiscal year 2024 [30].
Predictive algorithms now alter the fundamental architecture of go-to-market software. ServiceNow, Atlassian, and Datadog are actively embedding intelligent agents into their technical operations platforms [2]. Atlassian introduced its intelligence capabilities to 20,000 beta customers before pushing the features into premium commercial tiers [29]. These tools instantly summarize lengthy developer threads into concise marketing updates.
Hyperscale cloud providers pour extraordinary capital into the infrastructure required to run these models. Analysts expect Amazon, Microsoft, and Google to operate $1 trillion worth of intelligent servers by 2028 [31]. Total data center systems spending increased by nearly 35% in 2024 [1]. Chief information officers are migrating away from basic experimental pilots toward large-scale software integrations. Spending on AI-optimized servers will easily double spending on traditional servers in 2025, reaching $202 billion [31].
Asana executives specifically credit intelligent features for driving early sales upgrades. The company anticipates these automated workflows will generate substantial bookings through fiscal 2027 [32]. Vendors are shifting their pricing models to capitalize on this computational demand. Rather than charging flat monthly rates, some platforms introduce consumption-based pricing for advanced data queries. Snowflake demonstrates the profitability of this consumption-based approach within the broader software market [2].
Eighty percent of organizations will require post-launch adjustments due to unforeseen market disruptions by 2025 [13]. Planning tools must calculate the financial impact of these adjustments instantly. If a competitor releases a duplicate product two weeks before a scheduled launch, the software must model the revenue implications of accelerating the release date. Companies that rely on static spreadsheets cannot react to these disruptions effectively.
Conversion rates dictate the operational success of any go-to-market plan. The lead-to-opportunity conversion rate measures the exact percentage of marketing-generated leads that become qualified sales opportunities. The industry average hovers around 13% [33]. Top-performing aligned teams frequently hit 20% to 25% [33]. Both sides influence this metric because marketing controls lead quality while sales controls follow-up speed.
Target account advertising builds early awareness and engagement before sales representatives initiate contact. Marketing activity remains heavier during this initial stage. Data shows that targeted advertising increases top-of-funnel conversion from 1.78% to 7.55% [34]. High-intent accounts progress through the sales funnel three to five times faster when marketing and sales coordinate their outreach [34].
Laboratory data proves that the specific mix of marketing and sales touches predicts final outcomes. Closed-won deals typically include 27.5% fewer marketing touches but slightly more sales touches than lost deals [34]. More touches alone do not drive performance. The structured balance between marketing and sales engagement creates the actual revenue impact. Accounts receiving 180 to 190 cumulative sales touches over a year reach approximately 94% conversion into active opportunities [34].
Win rates vary significantly depending on the acquisition channel. Referral leads typically convert at rates between 35% and 50% [35]. In contrast, paid search leads often convert at roughly 18% [35]. Tracking these specific channel metrics allows software users to abandon unprofitable campaigns immediately. Aligned organizations achieve 208% higher marketing revenue because they adjust their investments based on real-time pipeline data [33].
Market execution dictates overall business survival. More than 80% of total revenue growth derives directly from optimizing a company's current core business operations [36]. About a quarter of companies fail to grow at all, and only one in eight achieve more than 10% annual revenue growth over a ten-year period [36]. Leaders must secure excellence in current operations before expanding into unproven markets.
Established vendors maintain aggressive expectations for future product releases. Executives believe 50% of their revenues will come from entirely new products or services within the next five years [36]. Between 2018 and 2020, new business building doubled its appearances among the top three items on executive agendas [36]. Launch planning software allows these companies to track multiple innovation horizons simultaneously.
Product managers evaluate these tools to calculate customer acquisition costs and lifetime value. Coordinated teams see lower acquisition costs through targeted efforts and higher conversion rates [37]. The length of the sales cycle indicates the efficiency of the combined process. Aligned teams reduce cycles through higher lead quality and coordinated prospect engagement [37]. Pipeline velocity shows how effectively teams advance these deals.
Data analytics capabilities define the next phase of software competition. The global data and analytics software market expanded by 13.9% in 2024, reaching a total valuation of $175.17 billion [38]. Modern launch teams require absolute visibility into customer behavior metrics. If marketing pushes a new feature announcement, the product team must instantly see whether user engagement spikes within the application interface.
Vendor evaluations increasingly focus on compliance tracking and regulatory documentation. Medical device manufacturers and financial technology firms face severe penalties for improper product releases. Launch planning systems generate detailed audit trails to prove that necessary security reviews occurred before deployment [9]. Software that lacks these strict governance controls cannot compete in regulated industries. Poor documentation prevents companies from implementing corrective actions swiftly [9].
The separation between product development and commercial execution continues to collapse. Applications that solely track engineering tickets hold declining value for executive buyers. Market dominance belongs to platforms that connect technical code deployments directly to active marketing campaigns and recorded sales calls. Software buyers will mercilessly cancel subscriptions for isolated planning tools that fail to prove direct revenue impact.
| Year | Market Size (USD Billions) |
|---|---|
| 2021 | 1.6 |
| 2022 | 2.1 |
| 2023 | 2.7 |
| 2024 | 3.3 |
| 2025 | 3.8 |
This trend demonstrates a rapid expansion in both the broader product launch software market and the highly specialized B2B buyer intent data sector. Between 2021 and 2025, the intent data market more than doubled, reaching an estimated 3.8 billion dollars as modern revenue teams increasingly reject static lead generation methods. [1]
At a micro level, individual Go-to-Market teams are shifting their budgets away from generic contact databases and pouring them into real-time signal tracking systems. Instead of simply buying lists of emails, companies are investing in tools that alert them the exact moment a prospect reads a competitor's pricing page or searches for a related solution. [2] On a macro industry scale, this signals a consolidation and maturation of the GTM software stack, where product launch success is no longer dictated by the volume of outreach, but by the precise timing of engagement. The projected growth of these platforms suggests that intent data will soon become table stakes for any competitive B2B product launch. [3]
This transformation is critically important because traditional product launch and marketing playbooks are yielding increasingly lower conversion rates. Engaging with prospects solely based on their firmographics or job titles wastes valuable sales resources on buyers who are not actively in the market. [4] By leveraging buyer intent software, organizations can dramatically shorten their sales cycles, increase their pipeline return on investment, and align their marketing, sales, and product teams around actual behavioral data rather than guesswork.
The catalyst for this shift is likely a combination of AI advancements and severe buyer fatigue. Business decision-makers are inundated with automated, cold outreach, rendering generic product launch campaigns highly ineffective. At the same time, machine learning algorithms have become sophisticated enough to process millions of passive behavioral signals—such as web traffic, content downloads, and forum discussions—and translate them into actionable, account-level intent scores. Furthermore, tightening economic conditions over the past few years have forced revenue leaders to scrutinize their technology budgets, favoring tools that offer clear, predictive indicators of revenue generation over vanity metrics. [5]
The integration of buyer intent data into product launch and GTM planning software marks a permanent evolution in how companies go to market. The days of "spray and pray" product launches are being rapidly replaced by surgically precise, intent-driven engagements. The most prominent takeaway is that future GTM success will belong to organizations that can operationalize real-time buyer signals faster than their competitors.