


There's no shortage of rankings that tell founders where they should start a business. Almost none explain to them what happens next: the labor costs that climb, the compliance mandates that compound, the tax burden that only appears once revenue scales. New analysis of all 50 states measures both sides of that equation using a Launch Score, a Sustainability Score, and an original metric called the Founder Trap Index that captures the gap between them.
Most "best states for business" rankings answer a narrow question: where is it cheapest to get started? This one asks the question that matters more: where do businesses actually survive? All 50 states are scored on launch conditions and on the factors that determine whether a company is still operating at year five.
To measure the full picture, the analysis scores each state twice.
The Launch Score captures what a founder sees in year one:
The Sustainability Score captures what that same founder sees in year five:
These are the costs that land squarely on the back office: from scaling payroll, managing workforce compliance, and keeping finance and HR operations running as revenue grows. By year five, a growing business is paying more than simply rent and wages. It's carrying a stack of software subscriptions across finance, HR, and sales, and the cost of that stack compounds faster in states where compliance mandates and payroll complexity demand more from each tool.
Two variables carry particular weight across both scores. Economic Dynamism, a composite of GDP growth, population growth, and business formation rate scaled 0 to 100, is the single strongest predictor of long-term viability in the dataset. The four highest-scoring states, Texas (96.3), Florida (92.8), Utah (84.0), and Arizona (83.9), all rank in the top 10 for sustainability.
The Talent Score rates each state's workforce on a 0 to 100 scale using two inputs: average weekly wages and unemployment rate. Wages serve as a proxy for the skill level and depth of the available labor pool, while unemployment captures how tight that market is. New York (68.1), Massachusetts (63.4), and Florida (59.4) score the highest.
Both scores run from 0 to 100. The gap between a state's sustainability rank and its launch rank produces the Founder Trap Score. The higher the number, the tougher running the business gets after day one. Washington (+18) and Alaska (+19) are the biggest traps, states that look strong at entry but deteriorate as operating costs build. Massachusetts (-21) and New Hampshire (-18) are the biggest hidden gems, states that look expensive at the door but quietly reward founders who stay.
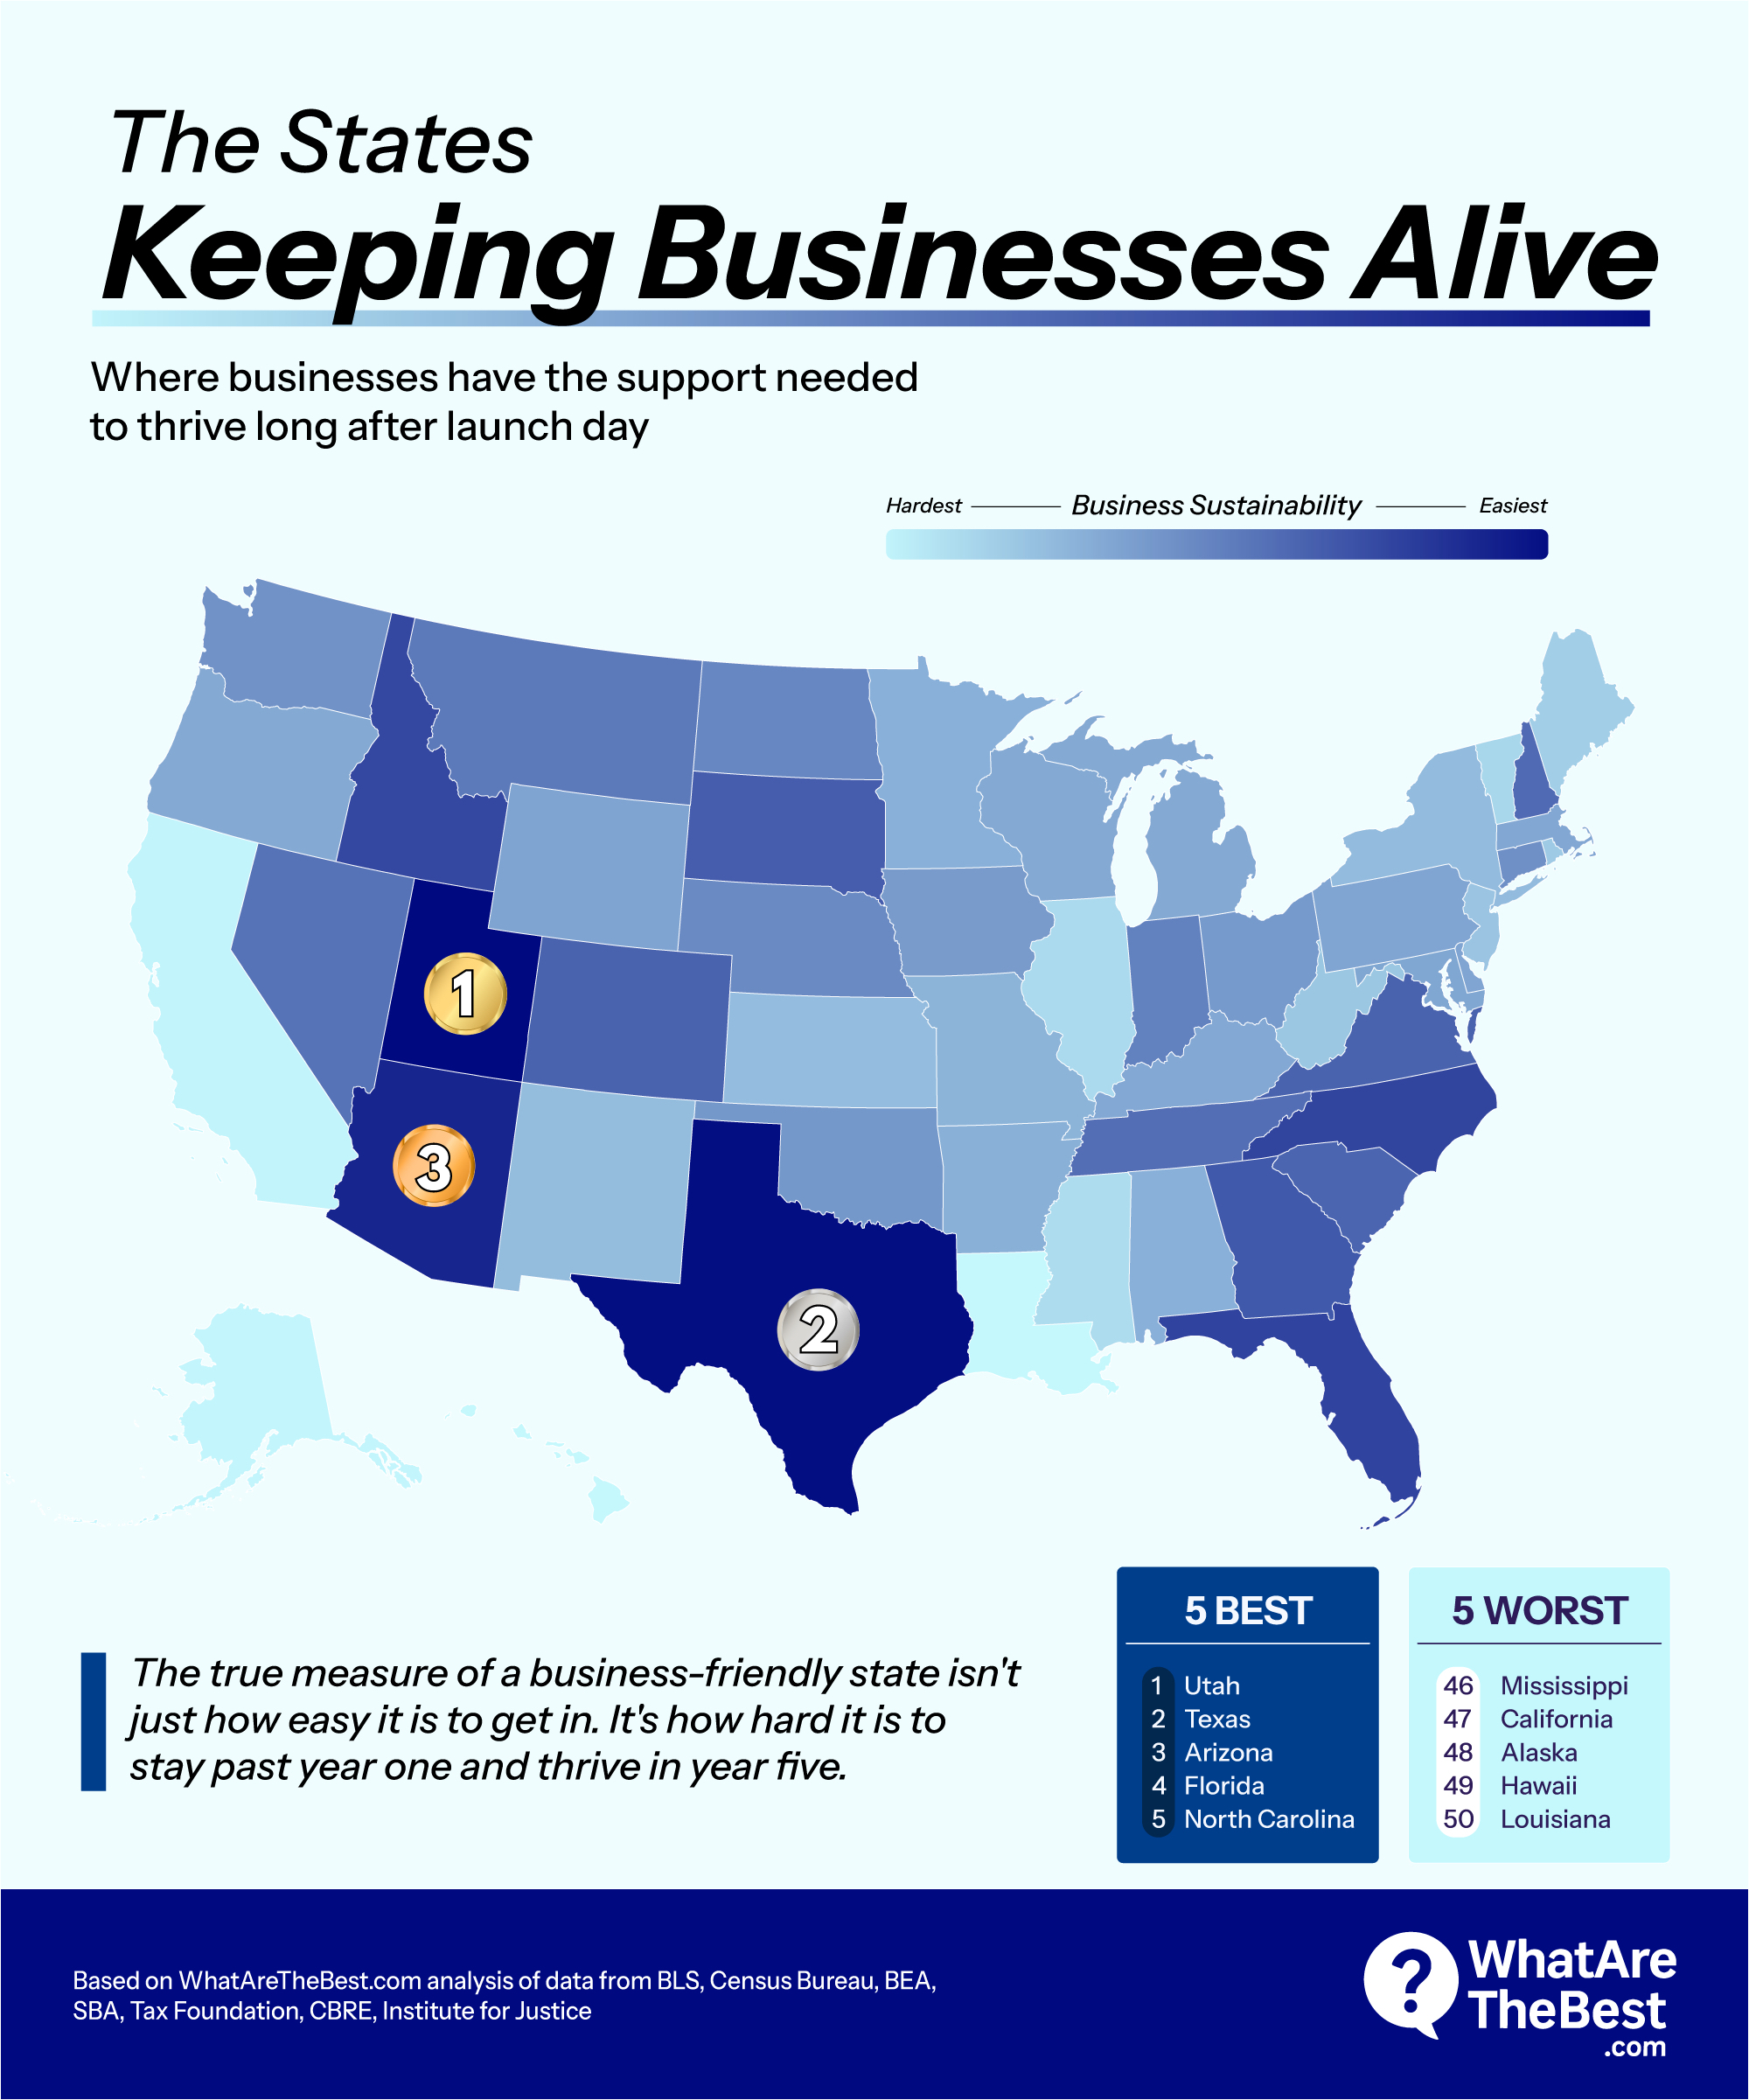
At the top of the sustainability rankings are Utah (75.5), Texas (74.7), and Arizona (71.3). At the bottom: Alaska (40.2), Hawaii (39.8), and Louisiana (39.8).

Key numbers:
Utah ranks No. 1 for both launching and sustaining a business. The year-one picture and the year-five picture look nearly identical, so for teams managing headcount growth and revenue scaling, there are fewer surprises in the budget. There is no founder trap here. What you see at launch is what you get.
Key numbers:
Texas has the highest economic dynamism in the dataset, and the low compliance load has a practical edge: fewer state-mandated filings, simpler payroll administration, and less time spent on regulatory work that pulls resources away from sales and growth. Businesses expanding across state lines face far less friction here. Texas actually improves by two positions between the launch and sustainability rankings, one of the few high-ranking states where the operating environment gets slightly better over time rather than worse.
Key numbers:
Arizona has the simplest formation structure of any top-ranked state. Like Utah, it carries a Founder Trap Score of zero: the launch conditions and the sustainability conditions tell the same story.
At launch (ranks No. 2):
By year five (drops to No. 20):
Washington is the study's clearest cautionary tale. It looks exceptional on launch day and unrecognizable five years later. A high minimum wage, paid family leave mandates, and heavy labor pressure compound into an operating burden that doesn't appear in the year-one profile. For growing businesses, those mandates translate into layered payroll complexity and HR compliance costs that build with every hire. The 18-position drop between launch and sustainability rankings is the widest of any top-five launch state, and Washington is the reason the Founder Trap Index exists.
Key numbers:
Massachusetts has the worst launch profile in the country after Vermont. Then the sustainability numbers arrive. The workforce is expensive because it's deep, skilled, and available, and that depth is what keeps five-year survival at 53.5% despite labor costs that would sink a business in a thinner market. Massachusetts is the strongest evidence in the dataset that high entry costs and strong long-term operating conditions can coexist.
Key numbers:
California ranks poorly for both launch (No. 39) and sustainability (No. 47), but the underlying data is more complicated than the rankings suggest. Strong survival rates and a massive economy are not enough to offset what it costs to operate there, where an 8.5-out-of-10 compliance burden pushes businesses into tax compliance software earlier than in most states. Businesses last in California despite the operating environment rather than because of it.
This analysis evaluates all 50 U.S. states across two composite indexes, each scaled 0 to 100. The Launch Score comprises six components (formation costs, first-year survival rate, SBA capital access, tax burden at $250,000 revenue, real estate pressure, and economic dynamism) weighted between 10% and 25%, with economic dynamism and survival rate receiving the highest weights. The Sustainability Score comprises seven components (ongoing formation costs, five-year survival rate, labor market pressure, real estate trajectory, tax burden at $1 million revenue, compliance burden, and economic dynamism), with survival, labor pressure, compliance, and dynamism each weighted at 20% and formation costs at 10%.
The Founder Trap Index is calculated as Sustainability Rank minus Launch Rank. Data sources include the Bureau of Labor Statistics (Business Employment Dynamics, QCEW, LAUS), U.S. Census Bureau, U.S. Small Business Administration (7(a) loan data), Tax Foundation (SBTCI, 2025), ALEC (Rich States, Poor States, 18th Edition), Institute for Justice (License to Work, 3rd Edition), CBRE/CoStar/CommercialEdge (office market data), Bureau of Economic Analysis, and the Kauffman Foundation.
Limitations: All figures represent state-level averages and do not capture metro or industry variation. The analysis is industry-neutral by design. Composite scores are best interpreted in tiers rather than as precise ordinal rankings. Two sources in the compliance index, ALEC and the Tax Foundation, are advocacy-affiliated organizations; their data was included for breadth but should be interpreted accordingly.