1. Home
  2. Business Intelligence & Analytics
  3. Business Intelligence (BI) & Dashboard Tools
  4. Business Intelligence & Dashboard Tools for Insurance Agents

Ranking · Business Intelligence (BI) & Dashboard Tools

Best Business Intelligence & Dashboard Tools for Insurance Agents

9 products scored on six criteria. Explore leads at 8.9 and the field is tight, with 0.2 points between first and last, so read the catches before you pick. Every product opens to the evidence behind its number.

9 products scored6 criteria87 sources citedUpdated Aug 7, 2026
1 Exploreguidewire.com

Explore cuts data prep from months to minutes

Read the reviewVisit ↗
2 Tableautableau.com

Tableau's insurance accelerators helped PEMCO free up $2 million

Read the reviewVisit ↗
3 Cobit Solutionscobit-solutions.com

Cobit posts real prices, $5K to $35K for insurance BI

Read the reviewVisit ↗
9Products
8.7 to 8.9Score spread
0Free plan or tier
01

The ranking

Order follows the score. Six little boxes show each product's criterion scores: green or red is above or below the category average, grey means too few products share that criterion to compare. The full review sits right under each one.

Nothing matches that filter here. Tap All to see every product.

1

Explore

guidewire.com · Explore: Insurance BI Software · scored Dec 2025

Explore cuts data prep from months to minutes

Best forP&C insurers running Guidewire InsuranceSuite policy and claims systems

Quote only SOC 2ISO 27001enterprise
Top score

Cloud-native BI tool embedded in Guidewire PolicyCenter and ClaimCenter for insurance analytics.

Standout factAnalysts report data prep time dropping from a month to minutes after adopting Explore.youtube.com
Biggest catchExplore only works inside the Guidewire Cloud Platform, not as standalone BI.lifeinsuranceinternational.com
500+Insurers using Guidewireguidewire.com
month to minutesReported prep time savingsyoutube.com

Adoption

500+insurers using Guidewire InsuranceSuite

Source: guidewire.com

In their words

“The process for us to get actionable insights out of our data would have taken a month to figure out with Explore, the dashboard takes minutes to create.”

youtube.com

Upside

  • Business Impact Monitoring dashboards
  • AI-powered Spotter natural search
  • Embedded directly in ClaimCenter workflows

Catch

  • Requires Guidewire Cloud Platform
  • Custom fields need Data Studio setup
  • Complex, consultant-heavy implementation
Pick it ifP&C insurers running Guidewire InsuranceSuite policy and claims systems
Skip it ifSmall agencies or insurers not using Guidewire's core systems
PricingQuote-based enterprise subscription

Editor's takeExplore scores 9.5 out of 10 for market credibility, the top mark among insurance BI tools rated here. Guidewire is publicly traded and used by more than 500 insurers worldwide. Actuarial analysts report data prep time dropping from a month to minutes after adopting the tool.

Does Explore work without other Guidewire products?

No. Explore runs on the Guidewire Cloud Platform and pulls data from InsuranceSuite, so it is not a standalone BI tool.

How much does Explore cost?

Pricing is not public. It follows a quote-based enterprise subscription model, and implementation often needs outside consultants.

The evidence: 6 criteria, 3 penalties (−0.19 points)
9.3
Product Capability & DepthLooked for: We look for specialized insurance analytics, pre-built data models, and advanced features like predictive monitoring.Explore offers pre-configured 'Financial Insights' for Policy and Claims, 'Business Impact Monitoring' for predictive models, and AI-driven 'Spotter' search.guidewire.comdocs.guidewire.comdocs.guidewire.com
9.5
Market Credibility & Trust SignalsLooked for: We look for adoption by major carriers, public trading status, and industry recognition.Guidewire is a publicly traded industry standard (NYSE: GWRE) used by over 500 insurers, with Explore adopted by major carriers like Beneva.guidewire.comlifeinsuranceinternational.comguidewire.com
8.8
Usability & Customer ExperienceLooked for: We look for ease of creating reports, intuitive interfaces for non-technical users, and workflow integration.Users report a massive reduction in data prep time (months to minutes), supported by drag-and-drop model builders and embedded dashboards.guidewire.comyoutube.comdocs.guidewire.com
8.2
Value, Pricing & TransparencyLooked for: We look for clear pricing models, ROI evidence, and transparent cost structures.Pricing is opaque, quote-based enterprise subscription; however, ROI is clearly demonstrated through operational efficiency gains.guidewire.comyoutube.comguidewire.com
9.0
Integration & Ecosystem StrengthLooked for: We look for seamless data flow from core systems and APIs for external tools.Explore is deeply integrated with InsuranceSuite via the Data Platform, though extending it requires specific upstream configuration.guidewire.comdocs.guidewire.comdocs.guidewire.com
9.1
Security, Compliance & Cloud ArchitectureLooked for: We look for cloud-native architecture, SOC 2 compliance, and robust data governance.Explore is a cloud-native app on Guidewire Cloud Platform (GWCP) with enterprise-grade security, RBAC, and compliance standards.guidewire.comguidewiremasters.indocs.guidewire.com

Score adjustments−0.19 points in total

−0.08Explore is heavily dependent on the Guidewire Cloud Platform and InsuranceSuite; it is not a standalone BI tool for non-Guidewire customers.lifeinsuranceinternational.com · severity 70/100
−0.04Implementation is described as complex and costly, often requiring specialized external consultants.g2.com · severity 60/100
−0.07Custom extension fields from core systems are not automatically available in Explore; they require manual configuration in Data Studio first.docs.guidewire.com · severity 50/100
2

Tableau

tableau.com · Tableau Insurance Analytics · scored Dec 2025

Tableau's insurance accelerators helped PEMCO free up $2 million

Best forData analysts at large carriers building custom risk visualizations.

From $15 per user/mo HIPAASalesforce integrationenterprise

Visual analytics platform with prebuilt insurance accelerators for fraud, claims and risk analysis.

Standout factPEMCO Insurance used Tableau to release $2 million in claims reserves.tableau.com
Biggest catchPerformance can lag when working with large datasets.thecxlead.com
$75/user/moCreator licensemammoth.io
4.4/5 (3,480 reviews)G2 ratingg2.com

Plans

Viewer$15/user/mo
Enterprise Creator$115/user/mo

advanced management features

Source: mammoth.io

In their words

“PEMCO... uses Tableau to accurately track and monitor all of its ongoing insurance claims, significantly improving closure rates”

tableau.com

Upside

  • Prebuilt accelerators for fraud and claims
  • HIPAA compliant on Tableau Cloud
  • Used by USAA and Progressive

Catch

  • Steep learning curve for advanced features
  • Performance lags on large datasets
  • Creator license runs $75/user/month
Pick it ifData analysts at large carriers building custom risk visualizations.
Skip it ifSmall agencies wanting a pre-built, done-for-you dashboard.
PricingCreator license from $75/user/mo, Viewer from $15/user/mo

Editor's takeTableau's insurance accelerators give carriers ready-made dashboards for fraud detection and claims tracking. PEMCO's documented $2 million reserve release backs that value. Reviewers still flag advanced calculations and large datasets as friction points.

Is Tableau HIPAA compliant?

Yes, on Tableau Cloud. It handles protected health information with encryption in transit and at rest, alongside SOC 2/3 and ISO 27001 certifications.

How much does Tableau cost for insurance teams?

Creator licenses run $75 per user per month, Viewer licenses $15 per user per month, and Enterprise Creator reaches $115 per user per month.

The evidence: 6 criteria, 3 penalties (−0.16 points)
9.3
Product Capability & DepthLooked for: Specific analytics features tailored to insurance workflows like claims processing, fraud detection, and risk assessment.Tableau offers specialized 'Accelerators' for insurance, including pre-built dashboards for fraudulent claims detection, broker performance, and claims lifecycle monitoring.tableau.comtableau.comexchange.tableau.com
9.6
Market Credibility & Trust SignalsLooked for: Adoption by major insurance carriers and validation from industry analysts.Tableau is the analytics standard for industry giants like Progressive, USAA, and Swiss Life, with widespread adoption across the Fortune 500 insurance sector.tableau.comtableau.comg2.com
8.7
Usability & Customer ExperienceLooked for: Ease of use for non-technical insurance professionals (underwriters, adjusters) versus data specialists.While the drag-and-drop interface is praised for basic tasks, users consistently report a steep learning curve for advanced functions and performance lags with massive datasets.tableau.comupsolve.aig2.com
8.5
Value, Pricing & TransparencyLooked for: Clear pricing models and value justification for insurance carriers of various sizes.Pricing is transparent ($75/$42/$15 per user), but costs scale quickly for enterprise features, and advanced AI or data management tools often require additional fees.tableau.commammoth.iojulius.ai
9.2
Security, Compliance & Data ProtectionLooked for: Connectivity with core insurance systems (Guidewire, Duck Creek) and broader data sources.Tableau integrates deeply with Salesforce (CRM Analytics) and connects to core insurance platforms like Guidewire and Duck Creek, alongside standard SQL/cloud data sources.tableau.comtableau.comcommunity.tableau.com
9.0
Industry Leadership & Innovation

Score adjustments−0.16 points in total

−0.06Users consistently report a steep learning curve for advanced features, requiring significant training or technical expertise beyond basic dashboarding.thecxlead.com · severity 60/100
−0.07Performance degradation is a documented issue when processing very large datasets or complex visualizations with multiple filters.g2.com · severity 55/100
−0.03Advanced AI features (Tableau Pulse premium) and Data Management add-ons require additional licensing fees, increasing Total Cost of Ownership.thoughtspot.com · severity 45/100
3

Cobit Solutions

cobit-solutions.com · COBIT BI for Insurance · scored Dec 2025

Cobit posts real prices, $5K to $35K for insurance BI

Best forInsurers wanting custom Power BI dashboards and ERP data unification.

From $5,000 one-time Power BItransparent pricingERP integration
−0.1 vs #1

A Power BI consultancy for insurers automating premium tracking and risk dashboards, with published pricing.

Standout factCobit Solutions holds a perfect 5.0 rating on Clutch across 29 reviews.clutch.co
Biggest catchThe flagship insurance case study is anonymous due to an NDA, limiting independent verification.cobit-solutions.com
5.0/5 (29 reviews)Clutch ratingclutch.co
$5,000-$35,000Package pricing rangeclutch.co

Plans

Small$5,000
Large$35,000

Source: clutch.co

Standout number

5.0/5Clutch rating across 29 client reviews

Source: clutch.co

Upside

  • Replaces manual Excel reporting
  • Transparent $5K-$35K pricing packages
  • Daily premium and risk tracking

Catch

  • Requires Power BI licensing
  • Steep learning curve for non-MS users
  • Primary case study is anonymous
Pick it ifInsurers wanting custom Power BI dashboards and ERP data unification.
Skip it ifTeams wanting a ready-made, plug-and-play SaaS product.
PricingFrom $5,000 (Small package) to $35,000 (Large), plus $25-$60/hr

Editor's takeCobit Solutions rebuilds insurer reporting on Power BI, replacing manual Excel sheets with automated daily premium tracking and risk dashboards. Pricing is published in plain packages from $5,000 to $35,000, a rarity in enterprise BI. Its flagship insurance client stays anonymous under NDA, and the platform depends on Power BI licensing and reliable internet.

How much does Cobit Solutions cost?

Packages are published at $5,000 for Small, $20,000 for Medium, and $35,000 for Large, with hourly consulting rates between $25 and $60.

Does Cobit Solutions require Power BI?

Yes. The platform is built on Microsoft Power BI, so clients need Power BI licensing, and users unfamiliar with Microsoft tools may face a learning curve.

The evidence: 6 criteria, 3 penalties (−0.15 points)
8.8
Product Capability & DepthLooked for: We evaluate the solution's ability to handle complex insurance-specific data modeling, risk analysis, and reporting needs beyond basic spreadsheets.The solution replaces legacy Excel reporting with automated Power BI dashboards specifically designed for insurance metrics like daily premium tracking (accrued vs. paid), risk management decision-making, and financial health indicators. It includes specialized modules for IT asset management within insurance firms and supports full balance sheet and P&L visualization.cobit-solutions.comcobit-solutions.comcobit-solutions.com
9.1
Market Credibility & Trust SignalsLooked for: We look for verified client reviews, case studies with named entities, and established industry presence.Cobit Solutions holds a perfect 5.0 rating on Clutch across 29 reviews and a 4.5 on Trustpilot. They claim experience with a 'Top-10 Insurance Company' (under NDA) and have documented success stories in related sectors like finance and manufacturing. The firm has been in business for 7 years with over 450 dashboards created.clutch.cocobit-solutions.com
8.9
Usability & Customer ExperienceLooked for: We assess the ease of adoption, quality of user interfaces, and availability of training or support resources.The solution leverages the familiar Microsoft interface, ensuring high usability for teams already in the MS ecosystem. Services include employee workshops and training on interactive dashboards. Users report the system is 'user-friendly' and appreciate the 'live' mode for real-time decision making, although non-Microsoft users may face a learning curve.cobit-solutions.comclutch.cog2.com
9.3
Value, Pricing & TransparencyLooked for: We look for clear, public pricing structures and evidence of return on investment for clients.Pricing is exceptionally transparent for this industry, with defined packages starting at $5,000 (Small) to $35,000 (Large) and hourly rates ($25-$60/hr) clearly listed. Client reviews consistently highlight 'value for money' and cost-effectiveness compared to larger competitors.cobit-solutions.comclutch.coclutch.co
9.0
Integration & Data EcosystemLooked for: We evaluate the system's ability to ingest data from disparate insurance legacy systems, ERPs, and CRMs.The solution excels at integrating with diverse IT systems including ERPs, CRMs, SQL, and Excel. It utilizes Power BI's extensive connector library (1,000+ connectors) to unify fragmented data sources into a single 'source of truth' data warehouse, supporting complex ETL processes.cobit-solutions.comcobit-solutions.comcobit-solutions.com
8.7
Security & ComplianceLooked for: We check for industry-standard security measures like encryption, access controls, and compliance support.The product implements 2-Factor Authentication (2FA) and role-based access controls to ensure data confidentiality. It relies on the enterprise-grade security of the Microsoft Azure cloud infrastructure to protect sensitive insurance data and manage governance.cobit-solutions.comcobit-solutions.com

Score adjustments−0.15 points in total

−0.07The solution is heavily dependent on the Microsoft Power BI ecosystem, which may limit customization compared to competitors like Tableau and requires clients to adopt specific licensing.cobit-solutions.com · severity 50/100
−0.04Users unfamiliar with Microsoft products may face a steeper learning curve, and the cloud-based model creates a dependency on reliable internet connectivity.cobit-solutions.com · severity 40/100
−0.04The primary insurance case study is anonymous ('Top-10 Insurance Company') due to NDA, which prevents independent verification of the specific client's identity.cobit-solutions.com · severity 35/100
4

InetSoft

inetsoft.com · InetSoft Department BI Dashboards · scored Dec 2025

InetSoft's advanced reports need a separate desktop app.

Best forDepartments needing to mash up data from legacy sources

From $2,800 per year data mashupembedded analyticson-premise or cloud
−0.1 vs #1

BI dashboard platform using Data Block technology to mash up disparate data sources in real time.

Standout factData Block technology lets users join tables from separate sources in real time, without building a data warehouse.inetsoft.com
Biggest catchAdvanced report design requires a separate desktop application called Style Studio rather than being fully web-based.g2.com
$2,800/yrEntry price, multi-user packagegetapp.com
5,000+Organizations deployedfeaturedcustomers.com
25%Fortune 500 usagefeaturedcustomers.com

Standout number

25%of Fortune 500 companies use InetSoft

Source: featuredcustomers.com

Starting price

$2,800/yearEntry multi-user package

Upside

  • Real-time data mashup across sources
  • Lower cost than Tableau or Cognos
  • Highly responsive customer support

Catch

  • Advanced design needs separate desktop tool
  • Interface described as aging
  • Smaller community than market leaders
Pick it ifDepartments needing to mash up data from legacy sources
Skip it ifSmall teams wanting a simple, single-function dashboard
PricingFrom ~$2,800/yr for multi-user package

Editor's takeInetSoft's Data Block technology joins tables from separate sources in real time, skipping the data warehouse build-out other BI tools require. Entry pricing around $2,800 a year undercuts Tableau and Cognos for departments with mixed legacy data. Advanced report design still needs a separate desktop tool called Style Studio, and the interface itself is described as showing its age.

How much does InetSoft cost?

Multi-user packages start around $2,800 a year, a lower entry point than many enterprise BI competitors, with both subscription and perpetual license options.

Does InetSoft need a data warehouse?

No. Its Data Block technology mashes up data from SQL, NoSQL, Excel, and ERP sources in real time without building a separate warehouse first.

The evidence: 6 criteria
9.2
Product Capability & Depthinetsoft.cominetsoft.com
8.8
Market Credibility & Trust Signalsinsurancejournal.com
8.7
Usability & Customer Experienceinetsoft.com
8.5
Value, Pricing & Transparencyinetsoft.com
8.9
Integrations & Ecosystem Strengthinetsoft.com
8.6
Security, Compliance & Data Protectioninetsoft.com
5

Insurity

insurity.com · Insurity BI Software · scored Dec 2025

22 of the top 25 P&C carriers use Insurity

Best forP&C carriers and MGAs already on Insurity's core platforms.

Quote only P&C insuranceQlik and Snowflakeenterprise
−0.1 vs #1

Embedded BI platform for P&C insurers, built on Qlik and Snowflake with 100+ dashboards.

Standout factInsurity is trusted by 22 of the top 25 P&C carriers and 7 of the top 10 MGAs in the US.insurity.com
Biggest catchUsers report the system can be really slow to load.g2.com
22 of 25Top 25 P&C carriers using Insurityinsurity.com
17,000+Data attributes availableinsurity.com

Adoption

22 of top 25US P&C carriers using Insurity

Source: insurity.com

Standout number

17,000+data attributes in the Data Depot

Source: insurity.com

Upside

  • Used by 22 of top 25 carriers
  • 100+ pre-built dashboards
  • AI-driven predictive analytics

Catch

  • Reports of slow loading times
  • Navigation can be time-consuming
  • No public pricing listed
Pick it ifP&C carriers and MGAs already on Insurity's core platforms.
Skip it ifLife and health insurers, or non-Insurity standalone BI buyers.
PricingCustom quote only, no public pricing

Editor's takeInsurity's BI product leans on its parent platform's dominance in P&C insurance rather than novel technology, embedding Qlik Sense and Snowflake to deliver over 100 dashboards and 17,000+ data attributes. That market position, serving 22 of the top 25 carriers, is the strongest evidence in its favor. The recurring complaint is speed, with G2 reviewers describing slow load times as a real daily friction point.

What technology powers Insurity's BI dashboards?

It embeds Qlik Sense for visualization and Snowflake for data management, giving carriers over 100 pre-built dashboards and access to more than 17,000 data attributes through its Data Depot.

Is Insurity BI Software slow to use?

Some G2 reviewers report significant loading delays and describe navigation as time-consuming, though others call the interface easy to use. Performance may vary by deployment.

The evidence: 6 criteria, 3 penalties (−0.14 points)
9.1
Product Capability & DepthLooked for: We evaluate the breadth of business intelligence features, specifically AI capabilities, visualization options, and data integration depth tailored for the P&C insurance sector.Insurity BI offers embedded analytics with over 100 pre-built dashboards, AI-driven predictive modeling, and geospatial analytics, powered by a strategic partnership with Qlik and Snowflake.insurity.cominsurity.cominsurity.com
9.4
Market Credibility & Trust SignalsLooked for: We assess market share, adoption by top-tier carriers, industry awards, and longevity in the insurance software market.Insurity holds a dominant market position, serving 22 of the top 25 P&C carriers in the US and receiving recognition as a 'Major Player' in IDC MarketScape reports.insurity.cominsurity.com
8.6
Usability & Customer ExperienceLooked for: We look for evidence of ease of use, intuitive design, and responsive support based on verified user reviews.While users find the system generally user-friendly and cost-effective, there are documented complaints regarding slow system loading times and navigation efficiency.insurity.comg2.comg2.com
8.5
Value, Pricing & TransparencyLooked for: We examine pricing models, public transparency, and ROI claims specifically for small to mid-sized insurance carriers.Pricing is not publicly listed, which is standard for enterprise software, but reviews cite it as 'cost-effective' for small-medium companies.insurity.comg2.cominsurity.com
9.0
Integrations & Ecosystem StrengthLooked for: We evaluate the platform's ability to connect with third-party data sources, core insurance systems, and API availability.Insurity Connect offers a low-code integration platform with support for 100+ insurance systems and a massive data attribute library via Data Depot.insurity.cominsurity.cominsurity.com
8.9
Data Intelligence & AILooked for: We assess the depth of AI application in predictive modeling, risk assessment, and data governance capabilities.The platform features 'Insurity Predict' for AI-driven loss ratio improvement and geospatial analytics, supported by a repository of 17,000+ data attributes.ffnews.cominsurity.com

Score adjustments−0.14 points in total

−0.06Users have reported significant performance issues, specifically regarding slow system loading times that force them to wait.g2.com · severity 60/100
−0.05Some users find the tool time-consuming to navigate, indicating potential UI/UX friction.g2.com · severity 45/100
−0.03Pricing is not transparently available on the website, requiring potential buyers to contact sales for quotes.insurity.com · severity 40/100
6

VCA Software

vcasoftware.com · VCA Insurance BI Tools · scored Dec 2025

VCA can implement claims BI in 2-3 weeks

Best forClaims adjusters, TPAs, and carriers needing Lloyd's of London compliance reporting.

From $299 per month Lloyd's complianceSOC IIclaims BI
−0.1 vs #1

Insurance claims BI platform with automated Lloyd's Bordereau reporting and real-time embedded dashboards.

Standout factOne mid-sized insurer cut average claim cycle time by 22% using VCA's dashboards.vcasoftware.com
Biggest catchLong-term users report regular pricing increases over time.getapp.com
22%Claim cycle time reduction, one insurervcasoftware.com
1994Company foundedsoftwareworld.co
4.9/5GetApp ratinggetapp.com

What changed

22%claim cycle time, one mid-sized insurer

Source: vcasoftware.com

Standout number

1994year VCA Software was founded

Source: softwareworld.co

Upside

  • Automated Lloyd's Bordereau reporting
  • Real-time embedded BI dashboards
  • 2-3 week implementation, Premier clients

Catch

  • Regular price increases reported
  • Document storage space limited
  • Query functions can feel limited
Pick it ifClaims adjusters, TPAs, and carriers needing Lloyd's of London compliance reporting.
Skip it ifSales teams wanting lead-generation analytics rather than claims BI.
PricingCustom quote; third-party sources list a starting point around $299/mo.

Editor's takeVCA automates Lloyd's of London Bordereau reporting, a compliance task that typically eats up manual hours, and claims here it delivers 100% compliant output. VCA Insights embeds real-time dashboards directly into the claims workflow, tracking adjuster workloads and reserve accuracy without switching tools; one mid-sized insurer reported a 22% cut in claim cycle time after adopting the dashboards. Premier clients can be live in 2 to 3 weeks, though some long-term users cite regular price increases and limited document storage.

Does VCA automate Lloyd's of London reporting?

Yes. VCA's bordereau reporting software produces reports that are 100% compliant with Lloyd's of London specifications, per VCA's product page.

How fast can VCA be implemented?

As little as 2 to 3 weeks for Premier clients, per VCA's website, faster than typical enterprise claims software rollouts.

The evidence: 6 criteria, 3 penalties (−0.16 points)
9.0
Product Capability & DepthLooked for: We evaluate the breadth of insurance-specific analytics, reporting automation, and claims management features.VCA offers embedded BI with real-time dashboards, specific modules for Lloyd's Bordereau reporting, and automated claims assignment.vcasoftware.comvcasoftware.comvcasoftware.com
9.1
Market Credibility & Trust SignalsLooked for: We look for user reviews, industry tenure, and adoption by reputable insurance entities.The company has been established since 1994 and holds high ratings (4.9/5) on major review platforms like GetApp and Capterra.insurancejournal.comgetapp.comsoftwareworld.co
8.8
Usability & Customer ExperienceLooked for: We assess ease of use, implementation speed, and interface design for non-technical claims adjusters.Users report the system is easy to learn with rapid implementation times of 2-3 weeks, though some cite storage limitations.vcasoftware.comvcasoftware.comg2.com
8.5
Value, Pricing & TransparencyLooked for: We look for clear pricing models, ROI evidence, and contract transparency.Pricing is quote-based with some starting figures visible on third-party sites; documented ROI includes significant time savings per claim.vcasoftware.comgetapp.comvcasoftware.com
8.9
Integrations & Ecosystem StrengthLooked for: We check for APIs and pre-built connections to major insurance and financial platforms.The platform integrates with key industry tools like XactAnalysis, CoreLogic, and Hover, as well as financial systems like QuickBooks.vcasoftware.comvcasoftware.com
9.4
Security, Compliance & Data ProtectionLooked for: We examine certifications like SOC II, HIPAA, and specific insurance regulatory compliance.VCA maintains SOC II compliance, Tier 1 data center hosting, and specific compliance with Lloyd's of London reporting standards.vcasoftware.comvcasoftware.com

Score adjustments−0.16 points in total

−0.06Users have reported that document storage space can be minimal and insufficient for some needs.g2.com · severity 60/100
−0.07Some users find the query and check writing functions to be limited.g2.com · severity 50/100
−0.03Long-term users have expressed concern regarding regular pricing increases.getapp.com · severity 45/100
7

AgencyBloc

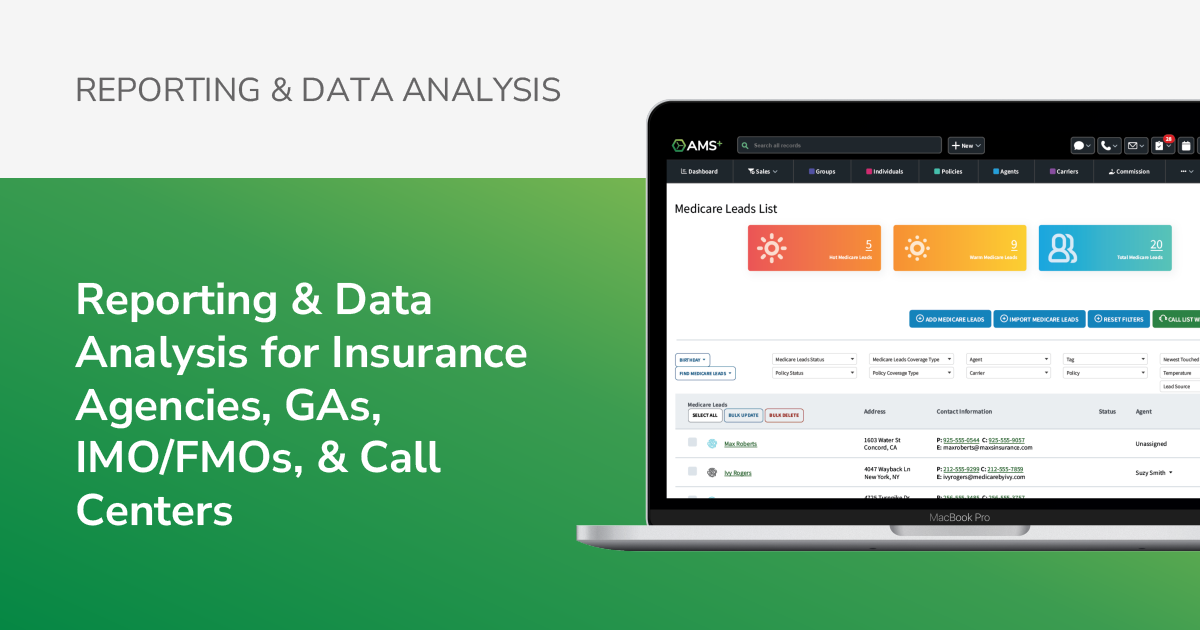
agencybloc.com · AMS+ Insurance Sales Analysis · scored Dec 2025

AgencyBloc pairs SOC 2 security with insurance-only tools.

Best forLife and health insurance agencies tracking commissions, retention, and agent productivity.

From $109 per user per month insuranceagency-managementhipaa
−0.2 vs #1

Industry-specific agency management system for health and life insurance agencies, covering sales analysis, commissions, and retention.

Standout factAgencyBloc undergoes regular HITRUST and SOC 2 Type II audits on top of HIPAA compliance.agencybloc.com
Biggest catchCommissions+ and Quote+ are billed as separate products, on top of the base AMS+ fee.agencybloc.com
$109/user/moStarting price
4.7/5G2 rating
9.6/10Security score

Six criteria vs category average

Product Capability & Depth
8.7
Market Credibility & Trust Signals
9.2
Usability & Customer Experience
8.9
Value, Pricing & Transparency
8.5
Security, Compliance & Data Protection
8.8
Support, Training & Onboarding Resources
9.0

Dark tick = category average

Fit

Pick it if you are

  • Agency leaders wanting to monitor agent productivity and retention
  • Independent agencies needing commission processing and sales tracking
  • Life and health insurance agencies

Skip it if you are

  • Property and Casualty (P&C) carriers
  • Large enterprises requiring complex actuarial risk modeling
  • Organizations not using the AMS+ agency management system

Upside

  • SOC 2 Type II and HIPAA compliant
  • Built only for health/life insurance
  • Custom report builder for KPIs

Catch

  • Reporting has a steep learning curve
  • Interface can feel cluttered
  • Commissions module costs extra
Pick it ifLife and health insurance agencies tracking commissions, retention, and agent productivity.
Skip it ifProperty and casualty carriers or firms needing complex actuarial risk modeling.
PricingFrom $109/user/month, Commissions+ and Quote+ billed separately

Editor's takeAgencyBloc builds its reporting fields and workflows specifically around health and life insurance agencies, a level of specialization generic CRMs rarely match. Security credentials go beyond HIPAA baseline requirements, adding HITRUST and SOC 2 Type II audits that matter to agencies handling sensitive client data. The tradeoff shows up in pricing, since core commission processing sits in a separate paid module.

Is AgencyBloc HIPAA compliant?

Yes. AgencyBloc is HIPAA compliant and undergoes regular HITRUST and SOC 2 Type II audits, according to the company.

Does AgencyBloc pricing include commission processing?

Not necessarily. The Commissions+ and Quote+ modules are sold separately from the base AMS+ package pricing.

The evidence: 6 criteria, 3 penalties (−0.14 points)
8.7
Product Capability & DepthLooked for: We evaluate the depth of sales analysis features, specifically custom reporting, real-time dashboards, and industry-specific data fields for health and life insurance.AgencyBloc offers a robust Custom Report Builder and real-time dashboards tailored for health and life insurance, allowing granular analysis of commissions, policy retention, and agent productivity.agencybloc.comagencybloc.comagencybloc.com
9.2
Market Credibility & Trust SignalsLooked for: We look for industry adoption, verified user reviews, and third-party security audits that establish trust in the insurance sector.AgencyBloc is a dominant player in the health/life insurance space, backed by SOC 2 Type II certification and high ratings across major review platforms.insurancebusinessmag.comagencybloc.comg2.com
8.9
Usability & Customer ExperienceLooked for: We assess the ease of navigation, quality of customer support, and the learning curve associated with complex features.Users consistently praise the customer support and general ease of use, though some report the interface can become cluttered and reporting features require significant time to master.agencybloc.comg2.comg2.com
8.5
Value, Pricing & TransparencyLooked for: We look for clear, public pricing structures and the inclusion of essential features without excessive hidden costs.Pricing is transparently listed starting at $109/user/month, but key modules like Commissions+ and Quote+ often require separate or additional investment.agencybloc.comgetapp.comagencybloc.com
8.8
Security, Compliance & Data ProtectionLooked for: We evaluate the breadth of native integrations with carriers, VoIP providers, and lead generation tools relevant to insurance.The platform offers strong niche integrations with tools like Ease, Employee Navigator, and Intulse VoIP, plus Zapier support for broader connectivity.agencybloc.comagencybloc.comagencybloc.com
9.0
Support, Training & Onboarding Resourcesagencybloc.com

Score adjustments−0.14 points in total

−0.04Key modules like Commissions+ and Quote+ are often treated as separate products or add-ons, potentially increasing the total cost of ownership beyond the base user fee.agencybloc.com · severity 50/100
−0.05Users report the interface can become cluttered, specifically citing unmanageable policy lines and an inability to delete old activities.g2.com · severity 45/100
−0.05The reporting feature, while powerful, has a documented steep learning curve that some users find difficult to master without significant time investment.g2.com · severity 40/100
8

Epic Dashboards

www1.appliedsystems.com · Epic Dashboards Data Visualizations · scored Dec 2025

Epic Dashboards data updates hourly, needs a Premium package

Best forIndependent agencies already using Applied Epic

From $230 per user/mo ISO 27001embedded analyticspersona-based
−0.2 vs #1

Embedded, persona-based analytics inside Applied Epic, turning agency data into visual insights without IT.

Standout fact96% of Applied Epic users rate it 4 or 5 stars on G2www1.appliedsystems.com
Biggest catchDashboard data refreshes only every 1 to 2 hours, not in real time.kitetechgroup.com
96%Users rating 4-5 starswww1.appliedsystems.com
7 of 10Top 10 brokers using itwww1.appliedsystems.com
~$230/user/moReported costreddit.com

Standout number

96%of Applied Epic users rate it 4 or 5 stars

Source: www1.appliedsystems.com

In their words

“Historically, I would have reached out to my IT department... but because we had Dashboards, I could pull it up myself and provide an answer within 30 seconds.”

globenewswire.com

Upside

  • Embedded directly in Applied Epic
  • Persona-based views by role
  • Drill-down to individual policies

Catch

  • Data updates only every 1-2 hours
  • Requires Premium or Pro package
  • Depends on clean manual data entry
Pick it ifIndependent agencies already using Applied Epic
Skip it ifAgencies using non-Applied management systems
PricingNot published, users report about $230/user/mo for Epic overall

Editor's takeEpic Dashboards embeds persona-based analytics directly inside Applied Epic, letting agents answer business questions in seconds instead of waiting on IT. Seven of the top 10 US brokers use Applied Epic, and 96% of users rate it 4 or 5 stars on G2. Data only refreshes every 1 to 2 hours, and Dashboards access requires a Premium or Pro package rather than being standard.

Is dashboard data real-time?

No. It updates automatically every 1 to 2 hours rather than instantly, which can delay time-sensitive insights.

Do all Applied Epic users get Dashboards?

No. Access depends on the agency's package, typically requiring Premium, Professional, or a Pro/Premium bundle.

The evidence: 6 criteria, 3 penalties (−0.18 points)
8.9
Product Capability & DepthLooked for: We evaluate the breadth of visualization tools, role-based customization, and drill-down capabilities available to different agency personas.Epic Dashboards provides embedded, persona-based analytics for roles like Principals and Producers, featuring drill-down capabilities to specific policies and customizable views.www1.appliedsystems.comwww1.appliedsystems.comwww1.appliedsystems.com
9.4
Market Credibility & Trust SignalsLooked for: We assess market share, user adoption rates, and third-party recognition within the insurance agency management sector.Applied Systems is the largest provider globally, and Applied Epic consistently ranks as a Leader in G2 reports with high user satisfaction.www1.appliedsystems.comwww1.appliedsystems.com
8.7
Usability & Customer ExperienceLooked for: We examine the user interface design, ease of accessing insights, and the learning curve for non-technical staff.Users report significant time savings compared to manual reporting, though the broader Epic platform is noted for having a steep learning curve.www1.appliedsystems.comglobenewswire.comg2.com
8.2
Value, Pricing & TransparencyLooked for: We look for clear public pricing, tier structures, and the accessibility of features across different subscription levels.Pricing is not publicly listed and access to Dashboards is restricted to specific premium packages or bundles, lacking transparency for prospective buyers.www1.appliedsystems.comkitetechgroup.comreddit.com
8.8
Integrations & Ecosystem StrengthLooked for: We assess how well the dashboards integrate with the core system, third-party apps, and the broader insurance technology ecosystem.Dashboards are natively embedded within Applied Epic, reducing context switching, and the platform supports a wide range of integrations like Outlook and Tarmika.www1.appliedsystems.comwww1.appliedsystems.comsourceforge.net
9.3
Security, Compliance & Data ProtectionLooked for: We evaluate certifications (SOC 2, ISO), data residency, and role-based access controls critical for handling sensitive insurance data.Applied Systems maintains robust security standards including SOC 2 Type 2 and ISO 27001 certifications, with strict role-based access controls for dashboards.www1.appliedsystems.comwww1.appliedsystems.comkitetechgroup.com

Score adjustments−0.18 points in total

−0.08Data in the dashboards is not real-time; it updates automatically every 1 to 2 hours, which may delay critical insights.kitetechgroup.com · severity 60/100
−0.04Access to Epic Dashboards is restricted to specific high-tier packages (Pro/Premium) or requires an additional subscription, limiting availability for base-tier users.kitetechgroup.com · severity 50/100
−0.06Dashboard accuracy is heavily dependent on manual data entry; poor data hygiene in the core system leads to incorrect visualizations.kitetechgroup.com · severity 45/100
9

Panorama Necto

panorama.com · Panorama Insurance BI · scored Dec 2025

Panorama Necto's UI feels dated, skips Mac and Linux

Best forLarge insurance carriers needing centralized governance and risk BI

Quote only centralized governanceanomaly detectioninsurance BI
−0.2 vs #1

Enterprise BI platform for insurers with centralized data governance, automated anomaly detection and infographic dashboards.

Standout factThird-party estimates put licensing at around $50 per user per monthpricingnow.com
Biggest catchAuthoring tools reportedly lack native support for Mac and Linux operating systems.saasadviser.co
$50/user/moEstimated starting pricepricingnow.com

In their words

“IT governs over the data to make sure it is protected... Using this model ensures data privacy and one version of the truth.”

panorama.com

Usability score (8.5/10)

85of 100

Upside

  • Automated anomaly detection for risk
  • Centralized IT-controlled data governance
  • Dynamic infographic dashboards

Catch

  • Interface called outdated
  • No native Mac or Linux support
  • API documentation called poor
Pick it ifLarge insurance carriers needing centralized governance and risk BI
Skip it ifSmall businesses wanting a lightweight, self-service dashboard tool
PricingCustom enterprise quote, estimated around $50/user/month

Editor's takePanorama Necto traces back to the OLAP technology Microsoft later rebranded as SQL Server Analysis Services, and it still leans on that centralized, IT-governed model to give insurers one version of the truth. Its anomaly detection flags data exceptions automatically instead of making risk teams dig for them. The interface has not kept pace though, with reviewers calling it outdated and authoring tools skipping Mac and Linux entirely.

Does Panorama Necto detect data anomalies automatically?

Yes. Its Suggestive BI features include automated data discovery and anomaly detection that continuously scan for exceptions so users do not miss key information.

Does Panorama Necto run on Mac or Linux?

Not for authoring. Reviewers report the authoring tools lack native Mac and Linux support, which limits use outside Windows environments.

The evidence: 6 criteria, 3 penalties (−0.15 points)
8.9
Product Capability & DepthLooked for: We evaluate the software's ability to handle complex insurance data, provide actionable risk insights, and support centralized reporting.Panorama Necto offers robust enterprise BI with specialized capabilities for insurance, including automated anomaly detection, risk mitigation analytics, and dynamic infographics that go beyond standard charting.panorama.companorama.companorama.com
9.0
Market Credibility & Trust SignalsLooked for: We look for established industry presence, reputable client bases, and a proven track record in the enterprise software market.Panorama Software has a prestigious history, having originally developed the OLAP technology acquired by Microsoft, and currently serves major financial institutions like PNC Financial Services.insurancejournal.companorama.comenlyft.com
8.5
Usability & Customer ExperienceLooked for: We assess the ease of creating reports, the intuitiveness of the interface, and the quality of user support.Users praise the 'simple UI' for handling large datasets and the power of its infographics, though some reviews point to an interface that feels outdated compared to newer competitors.panorama.cominsurancejournal.comg2.com
8.6
Value, Pricing & TransparencyLooked for: We look for clear ROI, competitive pricing models, and transparency in licensing costs for enterprise buyers.Reviewers describe the solution as cost-effective and a high-value alternative to more expensive BI tools, although public pricing transparency is low.panorama.comtrustradius.compricingnow.com
9.1
Security, Governance & ComplianceLooked for: We evaluate data governance capabilities, centralized control, and security measures critical for the insurance industry.Necto emphasizes a centralized governance model where IT retains strict control over data access and privacy, a critical requirement for handling sensitive insurance records.panorama.companorama.companorama.com
8.8
AI & Automated InsightsLooked for: We examine the integration of artificial intelligence for predictive analytics, anomaly detection, and automated reporting.The platform features 'Suggestive BI' and automated anomaly detection that proactively alerts users to data exceptions, reducing the manual effort required for risk monitoring.panorama.companorama.comgetapp.com

Score adjustments−0.15 points in total

−0.05Users have reported that the user interface feels outdated and lacks modern HTML5 standards in some areas.g2.com · severity 50/100
−0.05Reviewers have noted poor documentation regarding available APIs, which may hinder custom integration efforts.g2.com · severity 45/100
−0.05The software reportedly lacks native support for Mac and Linux operating systems for its authoring tools.saasadviser.co · severity 40/100
02

Side by side

10 features across 9 products. Green is yes, red is no, grey is not published.

FeatureExploreTableauCobit SolutionsInetSoftInsurityVCA SoftwareAgencyBlocEpic DashboardsPanorama Necto
Has Mobile App
Has Free Plan
Has Free Trial Contact for trial Contact for trial Contact for trial Contact for trial Contact for trial Contact for trial Contact for trial Contact for trial
Integrates With Zapier
Has Public API Enterprise API only Enterprise API only Enterprise API only Enterprise API only Enterprise API only Enterprise API only Enterprise API only Enterprise API only
Live Chat Support Email/Ticket only Email/Ticket only Email/Ticket only Email/Ticket only Email/Ticket only Email/Ticket only Email/Ticket only Email/Ticket only
SOC 2 or ISO Certified
Popular Integrations Salesforce, Google Workspace, Microsoft 365
Supports SSO Enterprise plans only Enterprise plans only Enterprise plans only Enterprise plans only Enterprise plans only Enterprise plans only Enterprise plans only Enterprise plans only
Starting Price Contact for pricing $15 per user/mo $5,000 one-time $2,800 per year Contact for pricing $299 per month $109 per user per month $230 per user/mo Contact for pricing
03

How we chose

Four fixed criteria for every product, plus two chosen for Business Intelligence & Dashboard Tools for Insurance Agents, weighted and reduced by documented penalties.

Full methodology
Criteria set for this categoryProduct Capability & Depth, Market Credibility & Trust Signals, Usability & Customer Experience, Value, Pricing & Transparency, Security, Compliance & Data Protection, Integrations & Ecosystem Strength
Evidence, then a scoreDocumentation, pricing pages, security pages and third-party reviews. Each criterion records what was found and links its sources.
Penalties, then a rankDocumented problems pull the score down with their evidence attached. Rank follows the score. Sponsored rows, where present, are labelled.
iProducts in this category are evaluated based on features such as data visualization capabilities, integration with existing insurance platforms, and compliance with regulatory standards.
Albert Richer
Albert RicherFounder · Memphis, TN

Sets the criteria and reviews the evidence before a ranking publishes. Email him if something here looks wrong.

04

Questions people ask

Does Explore work without other Guidewire products?

No. Explore runs on the Guidewire Cloud Platform and pulls data from InsuranceSuite, so it is not a standalone BI tool.

How much does Explore cost?

Pricing is not public. It follows a quote-based enterprise subscription model, and implementation often needs outside consultants.

Is Tableau HIPAA compliant?

Yes, on Tableau Cloud. It handles protected health information with encryption in transit and at rest, alongside SOC 2/3 and ISO 27001 certifications.

How much does Tableau cost for insurance teams?

Creator licenses run $75 per user per month, Viewer licenses $15 per user per month, and Enterprise Creator reaches $115 per user per month.

How much does Cobit Solutions cost?

Packages are published at $5,000 for Small, $20,000 for Medium, and $35,000 for Large, with hourly consulting rates between $25 and $60.

Does Cobit Solutions require Power BI?

Yes. The platform is built on Microsoft Power BI, so clients need Power BI licensing, and users unfamiliar with Microsoft tools may face a learning curve.

How much does InetSoft cost?

Multi-user packages start around $2,800 a year, a lower entry point than many enterprise BI competitors, with both subscription and perpetual license options.

Does InetSoft need a data warehouse?

No. Its Data Block technology mashes up data from SQL, NoSQL, Excel, and ERP sources in real time without building a separate warehouse first.

How is the best Business Intelligence & Dashboard Tools for Insurance Agents decided?

Every product is scored on six criteria for this category, with cited evidence and documented penalties. Rank follows the overall score. Vendors cannot pay for a position.

How often is this ranking updated?

Products are re-scored when pricing, features or evidence change. This ranking was last updated August 7, 2026.

05

More in Business Intelligence (BI) & Dashboard Tools

5 related rankings.

All of Business Intelligence (BI) & Dashboard
Research

Poor data quality extracts $12.9 million annually from the average enterprise

Apr 4, 2026

Spotify's annual churn rate hits 30.9% despite 205 million premium subscribers

May 22, 2026

90% of autonomous analytics initiatives lack necessary governance structures

May 20, 2026