

| Year | MMM Search Interest Index | Data-Driven Attribution Share (%) |
|---|---|---|
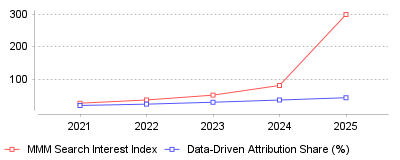
| 2021 | 25 | 18 |
| 2022 | 35 | 22 |
| 2023 | 50 | 28 |
| 2024 | 80 | 34.8 |
| 2025 | 300 | 42 |
This trend illustrates a rapid industry pivot away from granular, user-level Multi-Touch Attribution (MTA) toward aggregated, top-down Marketing Mix Modeling (MMM). According to recent industry data, interest in MMM surged by over 300% from 2021 to 2025, with an explosive 200% spike in mid-2025 alone [1].
On a micro level, digital marketing teams are abandoning tracking pixels and individual user paths because privacy updates like iOS 17 and cookie deprecation have shattered digital attribution accuracy [2]. Instead of fighting for incomplete user-level data, analysts are leveraging Bayesian regression and machine learning to analyze aggregate channel spend and broader macro trends. On a macro industry level, this represents a fundamental reallocation of analytics budgets away from legacy tracking software. Gartner's 2024 survey showed that 67% of marketing leaders plan to increase their investment in MMM, making it the highest adoption intent of any measurement methodology [3]. It signals that the analytics software industry is migrating from tracking-first platforms to predictive, data-science-first software ecosystems.
This transition is crucial because companies without proper attribution are commonly misallocating up to 30% of their marketing budgets to underperforming channels [4]. MTA models, which heavily relied on third-party cookies, now frequently mislead marketers by giving too much credit to last-click channels like branded search while ignoring top-of-funnel brand awareness [5]. By adopting modern, AI-powered MMM, brands can ensure privacy-safe, legally compliant measurement that still accurately guides millions of dollars in media investments.
The primary catalyst for this shift is the aggressive rollout of privacy-first technologies and legislation, specifically Apple's App Tracking Transparency (ATT), the deprecation of third-party cookies, and stringent GDPR enforcement. These changes effectively blinded legacy MTA models, which required stitching together individual user sessions across multiple websites to function properly [6]. Furthermore, the rise of artificial intelligence has made complex econometric modeling widely accessible to the masses. What used to take specialized data science teams months to calculate can now be run continuously through cloud-based AI pipelines using conversational interfaces.
The era of perfectly tracking a consumer's every click across the internet is over, ushering in a more sophisticated and privacy-compliant era of marketing analytics. As we look toward 2026, Marketing Mix Modeling is no longer an optional luxury for enterprise brands, but a strict survival framework for anyone looking to understand their true marketing efficiency [7]. The prominent takeaway is that brands must immediately pivot their measurement strategies to combine first-party data with algorithmic, aggregated modeling if they want to remain competitive and cost-efficient in a cookieless future.
Global spending on software designed to measure campaign effectiveness reached $4.74 billion in 2024 [1]. Grand View Research projects this category will grow to $10.10 billion by 2030, representing a 13.6% compound annual growth rate [2]. North America currently accounts for 42% of industry revenue, though the Asia-Pacific region will expand fastest through the end of the decade [3]. Large enterprises make up 66% of the customer base, and on-premise deployments still retain a 59% market share [1]. As capital flows continuously into broader marketing and advertising platforms, executives demand exact proof of return on ad spend. Specialized marketing attribution and analytics platforms have transitioned from experimental tools to mandatory infrastructure for enterprise revenue teams.
Organizations waste 21% of their advertising funds due to poor data quality [4]. Single-touch measurement models cause companies to misallocate up to 40% of their digital budgets [3]. Under last-click models, paid search budgets expand artificially because search ads frequently appear at the end of the conversion path. Brand awareness channels suffer perpetual underfunding because they generate initial interest rather than immediate sales. Adoption rates reflect a market recognizing this inefficiency. Among companies generating over $250 million in annual revenue, 73% now use multi-touch models [3]. Globally, 57% of organizations use dedicated measurement software, up from 40% in 2020 [3].
Privacy initiatives rarely reverse course completely, yet Google ended its Privacy Sandbox project in October 2025 [5]. Alphabet spent five years developing alternatives to third-party cookies. The search giant restricted tracking for 1% of Chrome users in January 2024 to test these alternatives [6]. Engineering teams then abandoned the complete deprecation plan in July 2024 [7]. Chrome proposed a user prompt for cookie acceptance instead. Google ultimately abandoned this scaled-back prompt in April 2025 [5]. Third-party cookies remain active indefinitely.
Financial risks heavily influenced this strategic retreat. Early tests showed programmatic revenue declined 34% for publishers using Google Ad Manager without cookies [8]. AdSense publishers saw 21% declines under the same conditions [8]. The United Kingdom's Competition and Markets Authority also investigated whether removing cookies gave Google an unfair competitive advantage, given the company's vast first-party data assets [9]. The advertising sector spent billions preparing for a tracking ban that never materialized. Marketers still face fragmented user paths across mobile and desktop interfaces. Systems capable of providing reliable cross-device measurement remain necessary despite the presence of legacy cookies.
In April 2025, the European Commission fined Apple €500 million [10]. Regulators determined Apple violated anti-steering rules under the Digital Markets Act. Developers could not inform customers about cheaper purchases outside the App Store. The Commission simultaneously issued a €200 million penalty to Meta [11]. Investigators found Meta's advertising structure violated consumer choice mandates. Meta had implemented a "consent or pay" model between March and November 2024, forcing users to either accept data tracking or pay for an ad-free service [12]. The DMA classifies companies like Alphabet, Amazon, Apple, ByteDance, Meta, and Microsoft as gatekeepers [13]. Gatekeepers face fines up to 10% of their global annual turnover for noncompliance [11].
Mobile tracking limitations caused severe financial damage prior to the DMA. Apple introduced the App Tracking Transparency framework in 2021. This update reduced Meta's 2022 revenue by $10 billion [14]. E-commerce brands relying heavily on Meta experienced a 37% decline in overall revenue following the update [15]. Small firms generating under $500,000 monthly saw 40% drops in customer acquisition [15]. Agencies require software built for paid media teams to mitigate ongoing signal loss. Losing off-site signal data increased the median cost per incremental customer by 31% [4].

Statistical analysis became highly accessible when Google launched Meridian. The search giant released this open-source tool to marketers in March 2024 [16]. Meridian uses Bayesian regression to calculate media effectiveness without requiring user-level tracking. The system incorporates Google Query Volume to separate organic search behavior from paid campaign lift [17]. Reach and frequency data from YouTube improves video measurement accuracy. Meridian allows a time-variant intercept, enabling models to capture general business growth alongside advertising impact [16].
Meta offers a competing product called Robyn. Robyn relies on Ridge regression to handle inconsistent datasets [18]. Both open-source options require significant data science proficiency. Engineers typically need three years of weekly historical data to train the models properly [19]. Many brands prefer commercial platforms featuring marketing mix modeling over maintaining custom Python or R scripts. Automation within commercial platforms reduces the manual workload associated with data ingestion and calibration.
Corporate consolidation accelerated as Snowflake acquired Samooha in December 2023 [20]. Samooha built templates that speed up data collaboration. LiveRamp purchased competing startup Habu shortly afterward [21]. These acquisitions highlight the rising financial value of clean rooms. Two brands can match customer records securely without exposing raw personal data. Snowflake enhanced its capabilities earlier in the year by acquiring LeapYear to add differential privacy protections [22].
Retail media networks rely heavily on this infrastructure. Nearly 66% of organizations use clean rooms in some capacity [23]. The global market for these environments reached $7.69 billion in 2024 [24]. Grand View Research expects this sector to hit $10.8 billion by 2030 [24]. Companies like Netflix and Kantar use Snowflake to advance their advertising strategies [25]. Buyers frequently seek attribution features linked directly to cloud data warehouses to reduce data extraction processes. Analyzing combined datasets under strict access controls produces aggregated insights without exposing personally identifiable information.
Advertisers committed $13.4 billion in gross platform spend through The Trade Desk in 2025 [26]. The programmatic buying platform generated $2.9 billion in revenue during the same period. This represents 18% year-over-year growth [27]. Fourth-quarter revenue alone reached $847 million. Net income hit $443 million for the full year. Operating margins held steady at 41% [27]. The company repurchased $1.4 billion of its Class A common stock and authorized an additional $500 million for future repurchases [28]. The firm maintains a customer retention rate above 95% [26].
Adoption of alternative identifiers fueled this financial performance. The Trade Desk built support for Unified ID 2.0. Databricks enabled UID2 support within its clean room environment [26]. Spotify integrated the European version of the identifier across its regional markets. HighTouch launched conversion tracking utilizing UID2. The company's Kokai platform reached two-thirds of its client base by the first quarter of 2025 [29]. Advertisers running campaigns through Kokai experienced up to a 43% lower cost per reach [30]. Measurement tools mapping the complete customer journey rely heavily on these deterministic identifiers to prove return on investment.
Following severe privacy-driven revenue drops, Snap reported clear financial improvements. The social network reached 422 million daily active users in the first quarter of 2024 [31]. This marks a 10% increase year-over-year. Quarterly revenue climbed 21% to $1.19 billion [32]. The company added 39 million active users over twelve months. Average revenue per user grew 13% globally to $1.13 [32]. North American average revenue per user climbed 16.8%, while European revenue per user jumped 20% [32].
Subscription products aided this recovery. Snapchat+ reached 9 million paying subscribers during the first quarter [32]. Total time spent watching Spotlight content increased 125% [31]. Free cash flow hit $38 million [31]. Operating losses improved slightly to $333 million [33]. Companies competing with dominant search platforms must continuously optimize their unit economics. A strict 3:1 ratio between lifetime value and acquisition cost prevents margin erosion [4].
Growth leaders face intense pressure to capture market share efficiently. Customer acquisition costs rose 60% over the five years leading up to 2024 [4]. Brands prioritizing volume over profitability suffer immediate margin destruction. The multi-touch segment currently dominates the analytics market, holding a 48% share [1]. Independent agencies use these analytics to prove campaign profitability to clients. Companies integrating financial data with marketing signals will outperform competitors relying solely on platform metrics.
| Year | MMM Search Interest Index | Data-Driven Attribution Share (%) |
|---|---|---|
| 2021 | 25 | 18 |
| 2022 | 35 | 22 |
| 2023 | 50 | 28 |
| 2024 | 80 | 34.8 |
| 2025 | 300 | 42 |
This trend illustrates a rapid industry pivot away from granular, user-level Multi-Touch Attribution (MTA) toward aggregated, top-down Marketing Mix Modeling (MMM). According to recent industry data, interest in MMM surged by over 300% from 2021 to 2025, with an explosive 200% spike in mid-2025 alone [1].
On a micro level, digital marketing teams are abandoning tracking pixels and individual user paths because privacy updates like iOS 17 and cookie deprecation have shattered digital attribution accuracy [2]. Instead of fighting for incomplete user-level data, analysts are leveraging Bayesian regression and machine learning to analyze aggregate channel spend and broader macro trends. On a macro industry level, this represents a fundamental reallocation of analytics budgets away from legacy tracking software. Gartner's 2024 survey showed that 67% of marketing leaders plan to increase their investment in MMM, making it the highest adoption intent of any measurement methodology [3]. It signals that the analytics software industry is migrating from tracking-first platforms to predictive, data-science-first software ecosystems.
This transition is crucial because companies without proper attribution are commonly misallocating up to 30% of their marketing budgets to underperforming channels [4]. MTA models, which heavily relied on third-party cookies, now frequently mislead marketers by giving too much credit to last-click channels like branded search while ignoring top-of-funnel brand awareness [5]. By adopting modern, AI-powered MMM, brands can ensure privacy-safe, legally compliant measurement that still accurately guides millions of dollars in media investments.
The primary catalyst for this shift is the aggressive rollout of privacy-first technologies and legislation, specifically Apple's App Tracking Transparency (ATT), the deprecation of third-party cookies, and stringent GDPR enforcement. These changes effectively blinded legacy MTA models, which required stitching together individual user sessions across multiple websites to function properly [6]. Furthermore, the rise of artificial intelligence has made complex econometric modeling widely accessible to the masses. What used to take specialized data science teams months to calculate can now be run continuously through cloud-based AI pipelines using conversational interfaces.
The era of perfectly tracking a consumer's every click across the internet is over, ushering in a more sophisticated and privacy-compliant era of marketing analytics. As we look toward 2026, Marketing Mix Modeling is no longer an optional luxury for enterprise brands, but a strict survival framework for anyone looking to understand their true marketing efficiency [7]. The prominent takeaway is that brands must immediately pivot their measurement strategies to combine first-party data with algorithmic, aggregated modeling if they want to remain competitive and cost-efficient in a cookieless future.