

3..
| Year | Market Size USD Billions | Vendors With GenAI Percent |
|---|---|---|
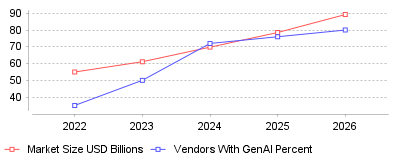
| 2022 | 54.95 | 35 |
| 2023 | 61.1 | 50 |
| 2024 | 69.78 | 72 |
| 2025 | 78.53 | 76 |
| 2026 | 89.25 | 80 |
The data reveals a dramatic juxtaposition between exponential financial growth in the embedded analytics sector and a severe operational bottleneck in the deployment of advanced artificial intelligence. On a macroeconomic scale, the embedded analytics market is surging, with valuations jumping from approximately $69.78 billion in 2024 to a projected $89.25 billion by 2026, and an estimated terminal trajectory of $169 billion to $230 billion by 2033 [1], [2], [3]. Concurrently, there is an aggressive technological arms race among software vendors, with AI adoption surging to 72% in 2024 and forecasts indicating that over 80% of software providers will feature embedded GenAI capabilities by 2026 [4]. However, this macro growth masks a severe micro-level failure rate known as the "GenAI Divide." According to the "State of AI in Business 2025" report by MIT, despite an estimated $30 to $40 billion injected into enterprise AI initiatives, a staggering 95% of GenAI pilots fail to scale or deliver measurable profit and loss (P&L) impact [5], [6]. Only an elite 5% of organizations have successfully integrated these intelligent analytics into production workflows, demonstrating that while exploration is nearly universal, actual execution remains highly elusive [7].
Furthermore, the metrics show a definitive transition in how end-users interact with their data. Traditional business intelligence—characterized by standalone dashboards, exported spreadsheets, and external reporting systems—is rapidly becoming obsolete, described by industry leaders as operating with a "foggy windshield" [8]. Instead, 81% of analytics users now explicitly prefer embedded insights over standalone tools, driving a massive migration toward self-service platforms [9]. The shift is so pronounced that the adoption rate of embedded analytics among business users is currently twice that of traditional BI solutions [10]. This data comprehensively shows that the market is hungry for in-app, contextual intelligence, but the mechanisms used to deliver this intelligence—specifically generative AI—are fundamentally struggling to meet enterprise-grade governance and reliability standards.
For the macro software industry, this data signifies that embedded analytics is transitioning from a static "checkbox" feature—used merely to satisfy procurement requirements—into a primary engine for product differentiation and direct revenue generation. Market projections reflect a compound annual growth rate (CAGR) ranging between 13% and 18.5%, fueled by demand for in-application, workflow-level integrations across multiple deployment models, with the cloud segment currently holding over 60% of the market share [11], [12]. Companies are actively monetizing these features by gating self-service exploration behind paid tiers, utilizing consumption-based pricing, and charging for app-based interactivity, which has resulted in reported revenue increases of up to 30% for businesses that properly commercialize their embedded analytics [13], [9]. From a micro-industry perspective, different sectors are leveraging this shift uniquely: the BFSI (Banking, Financial Services, and Insurance) sector commands over 20% of the market to power real-time risk assessments, while healthcare providers (where 66% of US institutions have embraced predictive BI) use embedded analytics to seamlessly manage clinical compliance and patient operations [14], [2].
Crucially, the "GenAI Divide" means that consumer-grade Large Language Models (LLMs) and generic AI wrappers are proving to be structurally incompatible with complex enterprise workflows. While these generic tools show high pilot-to-implementation rates (around 83%) for individual productivity tasks like email drafting, they face quiet rejection in enterprise environments due to brittle workflows, lack of contextual memory, and dangerous hallucinations [5]. Consequently, the industry is fragmenting. Leading vendors such as Reveal AI, Sigma, Tableau, and Querio are pivoting toward SDK-first, "agentic" analytics architectures that keep AI within the enterprise's security perimeter, allowing users to ask natural language questions directly inside an application without exposing sensitive data to external AI layers [15], [16]. This means that to survive the current market evolution, businesses must stop attempting to build isolated internal chatbots (which have a dismal 33% success rate) and instead partner with specialized experts to embed governed, prescriptive intelligence directly into their core applications [6].
Understanding the GenAI Divide within the embedded analytics market is absolutely critical because the financial and operational stakes are astronomically high. From an economic standpoint, the integration of embedded analytics at scale has the potential to unlock a staggering $9.5 trillion to $15.4 trillion in global value annually by automating complex decision-making and democratizing data across organizations [4]. By bringing actionable insights directly to the point of work, embedded platforms eliminate the friction of context-switching, delivering productivity lifts of 20% to 40% as users remain within their operational screens [2]. In high-stakes environments like manufacturing, embedding predictive analytics directly into SCADA systems has been shown to cut equipment downtime by 30% to 50%, completely altering the financial calculus of industrial operations [17].
Conversely, failing to navigate this transition effectively introduces severe existential risks for software vendors. Through 2025, at least 30% of GenAI projects will be entirely abandoned due to escalating costs, poor data quality, inadequate risk controls, and unclear business value [4]. Security and data privacy remain the top software development challenges, with 51% of tech leaders identifying security as their primary hurdle in AI adoption [18]. If an enterprise forces its users to rely on non-integrated, ungoverned AI systems, they risk catastrophic data leaks, compliance violations, and severe reputational damage. Therefore, resolving the GenAI Divide by successfully deploying secure, accurate, and embedded conversational analytics is not just a competitive advantage—it is a fundamental requirement to avoid becoming the "uninformed option" in an increasingly data-driven global economy [8].
The staggeringly high 95% failure rate of enterprise AI pilots amidst a booming analytics market is primarily caused by what industry experts term the "Verification Tax." In high-stakes regulated industries, AI models have a tendency to be "confidently wrong"; because users cannot trust the deterministic accuracy of generative models, they are forced to spend immense amounts of time manually forensically checking every AI-generated output, thereby completely neutralizing any promised efficiency gains [19]. Furthermore, this systemic failure is heavily exacerbated by poor underlying data architecture, adhering to the age-old principle of "garbage in, garbage out." If an organization's internal data is siloed, poorly formatted, or inconsistent, deploying an advanced AI overlay will only result in faster generation of dangerous, misleading insights [14]. In fact, 60% of organizations fail to realize the value of their augmented analytics specifically due to incohesive data governance frameworks [4].
Additionally, the market is suffering from severe "investment bias" driven by Fear Of Missing Out (FOMO). Boardrooms have rushed to fund highly visible, top-line generative AI pilots—such as generic sales chatbots—while neglecting the less glamorous but vastly higher-ROI back-office automation and core data pipeline improvements [7]. Internal development teams are also fundamentally overwhelmed by the sheer complexity of building multi-tenant, role-based, secure AI architectures from scratch, struggling with legacy systems and shifting analytics needs [4]. As a result, companies that attempt to build these capabilities internally face massive integration burdens, whereas those that treat embedded analytics as a transformative lever—anchoring their efforts in SDK-first partnerships that prioritize strict data sovereignty and contextual learning—are the ones breaking through the divide to achieve scalable, multi-million dollar business impacts [20], [21].
The embedded analytics industry has reached a critical inflection point, evolving from a supplementary reporting tool into the central intelligence layer of modern enterprise software. The data unequivocally shows that while the market is on a trajectory to exceed $200 billion over the next decade, the indiscriminate application of generic Generative AI is resulting in billions of dollars wasted in pilot purgatory. To successfully traverse the "GenAI Divide," software vendors must pivot away from disconnected AI wrappers and invest in highly governed, embedded AI platforms that offer true conversational analytics, robust data security, and deterministic accuracy. Ultimately, the organizations that successfully blend seamlessly integrated, self-service insights with trustworthy, workflow-specific AI will not only capture exponential market share but will fundamentally redefine how businesses operate in the digital age.
Global corporate spending on embedded reporting reached $22.93 billion in 2025 [1]. Fortune Business Insights projects this market to expand to $86.2 billion by 2034, registering a 15.68% annual growth rate [1]. North America generated $7.17 billion of this total revenue in 2025, driven by enterprise reliance on cloud infrastructure [1]. Cloud deployments currently command a 63.52% share of total installations [1].
Information technology and telecommunications sectors consume the largest portion of these products, representing 27.4% of total end users [2]. Software vendors increasingly integrate business intelligence and analytics software directly into their own applications to retain users and increase session durations. When a user must export a spreadsheet file to manipulate numbers externally, the host application loses engagement. Building embedded dashboards for customer facing portals keeps the user inside the primary workflow.
Row-level security failures expose technology vendors to immediate regulatory sanctions. Multi-tenant software designs allow hundreds of client organizations to share one database instance. This efficiency creates severe risk. Without isolation protocols, a user from one company might view financial records belonging to a competitor.
Software engineers manage this risk through programmatic context flow. A secure authentication layer must pass the user identity and permission parameters directly to the analytical engine [3]. JSON Web Tokens generate session credentials that carry user claims within their payload. When a client requests a chart, the application passes this payload to the database. The database engine applies the user identity to the SQL filter and returns only the rows matching that specific tenant ID [4]. Implementing embedded reporting tools for B2B applications requires these dynamic filters to enforce compliance with mandates like the Health Insurance Portability and Accountability Act [5].
Performance optimization presents another challenge for shared infrastructure. Analytic queries consume massive processing power. One client running an unoptimized query can slow down the application for all other tenants. Engineers mitigate this processing drag by establishing caching layers and materialized datasets for complex visualizations [4]. Independent database schemas provide maximum security but incur high administrative costs at scale. Most organizations choose shared databases protected by programmatic logic gates.

Microsoft added Copilot directly into Power BI during the fourth quarter of 2023, allowing users to query datasets using conversational English. Google quickly followed by integrating Vertex AI with Looker. Artificial intelligence integrations transform static charts into interactive query engines. The McKinsey Global Institute calculates that generative capabilities can add $4.4 trillion to global corporate profits annually [6].
Gartner forecasts that 80% of software vendors will embed generative models into their platforms by 2026 [2]. This rapid adoption stems from clear financial incentives. Incorporating self service embedded analytics for end customers directly reduces support costs. Users no longer submit tickets asking the data team to build custom reports. They simply type a question and receive an automated visualization. Teams using these automated platforms complete tasks 77% faster than peers relying on manual extraction [7].
Despite this momentum, technical limitations remain. Generative models struggle with numerical forecasting. Gartner explicitly warns enterprises against relying on large language models for predictive statistical modeling, noting that traditional machine learning algorithms produce more accurate numeric forecasts [8]. Decision intelligence requires deterministic math rather than probabilistic text prediction.
Allocating internal engineers to build a custom visualization library diverts resources from core product development. Product managers often underestimate the complexity of data rendering. Constructing a basic charting interface seems simple initially. Users inevitably demand export functions, conditional formatting, and scheduled email deliveries within six months.
Custom development requires approximately eight months for a standard engineering team, costing an estimated $350,000 in base salaries alone [9]. This figure excludes ongoing maintenance and server expenses. Forty-two percent of organizations cite limited technical staff as their primary obstacle to successful deployment [9]. Purchasing commercial embedded analytics platforms eliminates this capital drain. External vendors spread their research costs across thousands of clients.
Pricing models influence this purchasing decision heavily. Consumption-based pricing penalizes high usage. If an application successfully drives user engagement, the software vendor faces an unpredictable monthly invoice. Many buyers now demand fixed-fee licenses to protect their profit margins as their user base expands.
Looker relies on an abstraction language called LookML to define metric logic centrally. Google engineered this platform to run directly against cloud data warehouses like BigQuery and Snowflake. It pushes the computational load down to the warehouse rather than extracting data into a separate memory engine [10]. LookML operates as a translation layer above native SQL. Data engineers write configuration files defining dimensions once, and the platform compiles these definitions into optimized queries. This architecture prevents metric discrepancies across different departments.
Microsoft dominates the corporate segment through aggressive pricing and native Office 365 compatibility. Power BI Pro licenses cost $14 per user monthly [10]. Analysts familiar with Excel formulas adapt quickly to Data Analysis Expressions. Integrating Power BI into external commercial applications requires specific capacity nodes that follow distinct pricing structures.
Tableau prioritizes visual exploration. Salesforce weaves Tableau components directly into its customer relationship management software. Healthcare organizations frequently select Tableau for clinical research visualization, while relying on governance platforms like MicroStrategy for protected patient records [10].
Asia Pacific represents the fastest-growing geographical segment. This region generated $5.2 billion in 2025, accounting for 22.67% of global volume [1]. Nations including Japan, Singapore, and India continue to increase their digital infrastructure investments [1]. Regulatory policies dictate much of this architectural planning. Data localization laws force vendors to host analytical engines within specific national borders.
Manufacturing facilities deploy real-time monitoring to optimize supply chains. Forty-one percent of supply chain operators recorded cost reductions between 10% and 19% after implementing artificial intelligence tools [7]. Retail sectors use point-of-sale data to adjust inventory levels dynamically. The McKinsey Global Institute estimates that retail operations will gain up to $660 billion in operating profits annually through automated intelligence [11].
Banking organizations command immense value from localized data processing. Financial institutions face auditing requirements from agencies like the Securities and Exchange Commission. Embedding visual monitoring directly into trading platforms reduces the risk of missed compliance alerts. Automated tools in banking deliver up to $340 billion in additional annual value [11].
Algorithms cannot fix bad inputs. The average enterprise loses $12.9 million annually due to poor data quality [2]. Organizations storing disconnected spreadsheets face analytical bottlenecks. Forrester Research reports that 40% of data leaders cite integration across different systems as their primary technical obstacle [2].
Semantic layers solve this fragmentation. A semantic layer sits between raw database tables and the visual dashboard. It translates SQL columns into human-readable business terms. An engineer defines a revenue metric once in this central repository. Every subsequent chart querying that metric inherits that exact calculation. This structure eliminates conflicting reports presented during board meetings.
Data preparation historically consumed the majority of an analyst's schedule. Automated pipelines now ingest raw inputs, normalize formatting, and load clean datasets into cloud warehouses. Organizations standardize on platforms like Databricks or BigQuery to store massive volumes of unstructured information [12]. The analytical interface merely queries this prepared repository, ensuring fast load times for the end user.
Worker output increases measurably when software removes manual data extraction. Economists calculate that automated intelligence will boost global labor productivity by 0.1% to 0.6% annually through 2040 [11]. The Digital Cooperation Organization states that healthcare networks alone stand to gain $110 billion annually through improved operational workflows [13].
Analysts currently spend significant portions of their workweek toggling between disconnected interfaces. Context-switching destroys concentration. Consolidating tools into a single pane of glass recovers this lost time. Forrester indicates that analysts lose up to 40% of their daily productivity switching between four or more separate analytical platforms [2].
Software vendors monetize this recovered time. They introduce premium product tiers containing advanced statistical features. Customers gladly pay higher subscription fees to access predictive tools that eliminate their own manual labor. According to industry surveys, 31.4% of organizations deploy embedded reporting specifically to generate direct revenue streams [2].
Successful deployment requires meticulous architectural planning. Teams must map exact user permissions before writing any integration code. An implementation typically unfolds over a 30-day timeline [14]. The first phase defines the precise metrics relevant to the target audience. The second phase connects raw data sources to a reusable semantic model.
Authentication protocols secure the third phase. Engineers integrate authorization services to ensure frictionless access. The final phase involves iterative design adjustments based on user telemetry. Application owners track which charts users view and which filters they ignore. This feedback loop dictates future development sprints.
Alteryx emphasizes that modern architectures remove the need for heavy internal coding [15]. Software development kits provide pre-built JavaScript components. Developers inject these components directly into the host application code. This modular approach accelerates product releases while maintaining a native visual aesthetic.
Batch processing systems fail to support modern operational requirements. Legacy architectures relied on scheduled scripts to extract, transform, and load records into central repositories. Business leaders viewing a dashboard at noon reviewed statistics that were twelve hours old. E-commerce platforms adjusting prices based on competitor movements require latency measured in milliseconds.
Stream processing engines solve this delay. Apache Kafka and Apache Flink capture continuous feeds of event data. They process transactions as they occur. Organizations deploying these architectures display instant updates on their internal screens. Seventy-five percent of surveyed businesses recently invested in these processing systems [16]. Over 80% of those buyers reported direct financial gains resulting from faster reaction times [16].
Memory computing further accelerates these operations. Storing active datasets in Random Access Memory bypasses the physical limitations of reading from solid-state drives. Complex queries filtering millions of rows execute instantly. This infrastructure costs significantly more than standard storage, forcing technology leaders to balance performance demands against cloud computing budgets.
Deploying sophisticated software guarantees nothing if employees refuse to abandon their legacy spreadsheets. Data literacy remains a persistent hurdle across all industrial sectors. Hanover Research indicates that 86% of application teams believe their software adequately supports user fluency [17]. Reality contradicts this optimism. Only 15% of deployed applications actually provide the intuitive interfaces necessary for non-technical staff [17].
Corporate training programs frequently miss the mark. They teach employees how to click specific buttons rather than explaining the underlying statistical logic. Effective adoption strategies embed contextual tutorials directly inside the visual interface. Tooltips define complex metrics on hover. Automated narratives summarize chart anomalies in plain text.
User engagement metrics determine the success of an integration project. High daily active user counts justify the ongoing licensing fees. Conversely, if telemetry shows that 90% of clients only use the export button, the visual interface has failed its primary objective. The design must match the host application precisely, deploying identical font families, color palettes, and navigation menus.
Compliance frameworks will force vendors to adopt stricter auditing mechanisms over the next 24 months. As artificial intelligence generates more automated decisions, regulators demand explainability. The European Union Artificial Intelligence Act establishes strict transparency rules for categorization systems. Analytical software identifying financial fraud or screening employment applications must maintain exact logs of how variables influence outputs.
Software architectures will shift toward edge processing to reduce latency. Processing data near the collection source speeds up visualization loading times. This localized computation assists with data privacy compliance, as sensitive information never travels to a centralized server.
Predictive algorithms will merge with prescriptive action triggers. A dashboard will not simply highlight dropping inventory levels. It will automatically draft a purchase order and route it to the procurement manager for approval. These closed-loop systems represent the final evolution of enterprise reporting.
3..
| Year | Market Size USD Billions | Vendors With GenAI Percent |
|---|---|---|
| 2022 | 54.95 | 35 |
| 2023 | 61.1 | 50 |
| 2024 | 69.78 | 72 |
| 2025 | 78.53 | 76 |
| 2026 | 89.25 | 80 |
The data reveals a dramatic juxtaposition between exponential financial growth in the embedded analytics sector and a severe operational bottleneck in the deployment of advanced artificial intelligence. On a macroeconomic scale, the embedded analytics market is surging, with valuations jumping from approximately $69.78 billion in 2024 to a projected $89.25 billion by 2026, and an estimated terminal trajectory of $169 billion to $230 billion by 2033 [1], [2], [3]. Concurrently, there is an aggressive technological arms race among software vendors, with AI adoption surging to 72% in 2024 and forecasts indicating that over 80% of software providers will feature embedded GenAI capabilities by 2026 [4]. However, this macro growth masks a severe micro-level failure rate known as the "GenAI Divide." According to the "State of AI in Business 2025" report by MIT, despite an estimated $30 to $40 billion injected into enterprise AI initiatives, a staggering 95% of GenAI pilots fail to scale or deliver measurable profit and loss (P&L) impact [5], [6]. Only an elite 5% of organizations have successfully integrated these intelligent analytics into production workflows, demonstrating that while exploration is nearly universal, actual execution remains highly elusive [7].
Furthermore, the metrics show a definitive transition in how end-users interact with their data. Traditional business intelligence—characterized by standalone dashboards, exported spreadsheets, and external reporting systems—is rapidly becoming obsolete, described by industry leaders as operating with a "foggy windshield" [8]. Instead, 81% of analytics users now explicitly prefer embedded insights over standalone tools, driving a massive migration toward self-service platforms [9]. The shift is so pronounced that the adoption rate of embedded analytics among business users is currently twice that of traditional BI solutions [10]. This data comprehensively shows that the market is hungry for in-app, contextual intelligence, but the mechanisms used to deliver this intelligence—specifically generative AI—are fundamentally struggling to meet enterprise-grade governance and reliability standards.
For the macro software industry, this data signifies that embedded analytics is transitioning from a static "checkbox" feature—used merely to satisfy procurement requirements—into a primary engine for product differentiation and direct revenue generation. Market projections reflect a compound annual growth rate (CAGR) ranging between 13% and 18.5%, fueled by demand for in-application, workflow-level integrations across multiple deployment models, with the cloud segment currently holding over 60% of the market share [11], [12]. Companies are actively monetizing these features by gating self-service exploration behind paid tiers, utilizing consumption-based pricing, and charging for app-based interactivity, which has resulted in reported revenue increases of up to 30% for businesses that properly commercialize their embedded analytics [13], [9]. From a micro-industry perspective, different sectors are leveraging this shift uniquely: the BFSI (Banking, Financial Services, and Insurance) sector commands over 20% of the market to power real-time risk assessments, while healthcare providers (where 66% of US institutions have embraced predictive BI) use embedded analytics to seamlessly manage clinical compliance and patient operations [14], [2].
Crucially, the "GenAI Divide" means that consumer-grade Large Language Models (LLMs) and generic AI wrappers are proving to be structurally incompatible with complex enterprise workflows. While these generic tools show high pilot-to-implementation rates (around 83%) for individual productivity tasks like email drafting, they face quiet rejection in enterprise environments due to brittle workflows, lack of contextual memory, and dangerous hallucinations [5]. Consequently, the industry is fragmenting. Leading vendors such as Reveal AI, Sigma, Tableau, and Querio are pivoting toward SDK-first, "agentic" analytics architectures that keep AI within the enterprise's security perimeter, allowing users to ask natural language questions directly inside an application without exposing sensitive data to external AI layers [15], [16]. This means that to survive the current market evolution, businesses must stop attempting to build isolated internal chatbots (which have a dismal 33% success rate) and instead partner with specialized experts to embed governed, prescriptive intelligence directly into their core applications [6].
Understanding the GenAI Divide within the embedded analytics market is absolutely critical because the financial and operational stakes are astronomically high. From an economic standpoint, the integration of embedded analytics at scale has the potential to unlock a staggering $9.5 trillion to $15.4 trillion in global value annually by automating complex decision-making and democratizing data across organizations [4]. By bringing actionable insights directly to the point of work, embedded platforms eliminate the friction of context-switching, delivering productivity lifts of 20% to 40% as users remain within their operational screens [2]. In high-stakes environments like manufacturing, embedding predictive analytics directly into SCADA systems has been shown to cut equipment downtime by 30% to 50%, completely altering the financial calculus of industrial operations [17].
Conversely, failing to navigate this transition effectively introduces severe existential risks for software vendors. Through 2025, at least 30% of GenAI projects will be entirely abandoned due to escalating costs, poor data quality, inadequate risk controls, and unclear business value [4]. Security and data privacy remain the top software development challenges, with 51% of tech leaders identifying security as their primary hurdle in AI adoption [18]. If an enterprise forces its users to rely on non-integrated, ungoverned AI systems, they risk catastrophic data leaks, compliance violations, and severe reputational damage. Therefore, resolving the GenAI Divide by successfully deploying secure, accurate, and embedded conversational analytics is not just a competitive advantage—it is a fundamental requirement to avoid becoming the "uninformed option" in an increasingly data-driven global economy [8].
The staggeringly high 95% failure rate of enterprise AI pilots amidst a booming analytics market is primarily caused by what industry experts term the "Verification Tax." In high-stakes regulated industries, AI models have a tendency to be "confidently wrong"; because users cannot trust the deterministic accuracy of generative models, they are forced to spend immense amounts of time manually forensically checking every AI-generated output, thereby completely neutralizing any promised efficiency gains [19]. Furthermore, this systemic failure is heavily exacerbated by poor underlying data architecture, adhering to the age-old principle of "garbage in, garbage out." If an organization's internal data is siloed, poorly formatted, or inconsistent, deploying an advanced AI overlay will only result in faster generation of dangerous, misleading insights [14]. In fact, 60% of organizations fail to realize the value of their augmented analytics specifically due to incohesive data governance frameworks [4].
Additionally, the market is suffering from severe "investment bias" driven by Fear Of Missing Out (FOMO). Boardrooms have rushed to fund highly visible, top-line generative AI pilots—such as generic sales chatbots—while neglecting the less glamorous but vastly higher-ROI back-office automation and core data pipeline improvements [7]. Internal development teams are also fundamentally overwhelmed by the sheer complexity of building multi-tenant, role-based, secure AI architectures from scratch, struggling with legacy systems and shifting analytics needs [4]. As a result, companies that attempt to build these capabilities internally face massive integration burdens, whereas those that treat embedded analytics as a transformative lever—anchoring their efforts in SDK-first partnerships that prioritize strict data sovereignty and contextual learning—are the ones breaking through the divide to achieve scalable, multi-million dollar business impacts [20], [21].
The embedded analytics industry has reached a critical inflection point, evolving from a supplementary reporting tool into the central intelligence layer of modern enterprise software. The data unequivocally shows that while the market is on a trajectory to exceed $200 billion over the next decade, the indiscriminate application of generic Generative AI is resulting in billions of dollars wasted in pilot purgatory. To successfully traverse the "GenAI Divide," software vendors must pivot away from disconnected AI wrappers and invest in highly governed, embedded AI platforms that offer true conversational analytics, robust data security, and deterministic accuracy. Ultimately, the organizations that successfully blend seamlessly integrated, self-service insights with trustworthy, workflow-specific AI will not only capture exponential market share but will fundamentally redefine how businesses operate in the digital age.