
As of April 2026, current U.S. gas prices have surged past $4 per gallon for the first time since 2022; driven by escalating military conflict, unpredictable rhetoric, and spreading tensions. The largest supply disruption in recent memory is upon us, and drivers are absorbing the impact in real time.
We wanted to know how close Americans are to being driven to their financial limit, what gas price would force them to fundamentally change their lives, and who they hold responsible. So we surveyed 2,000 U.S. adults across all 50 states. The findings suggest the breaking point isn't hypothetical for everyone. Some states have already crossed theirs, and others are close behind.
To measure which states are under the most pressure, we compared each state's current AAA gas price against the median price at which that state's residents say gas becomes unaffordable. The gap between those two numbers shows how much room each state has left before hitting its limit. A negative gap means the state has already crossed the line. Across all 50 states, the median price Americans say would make gas unaffordable is $4.93 per gallon.
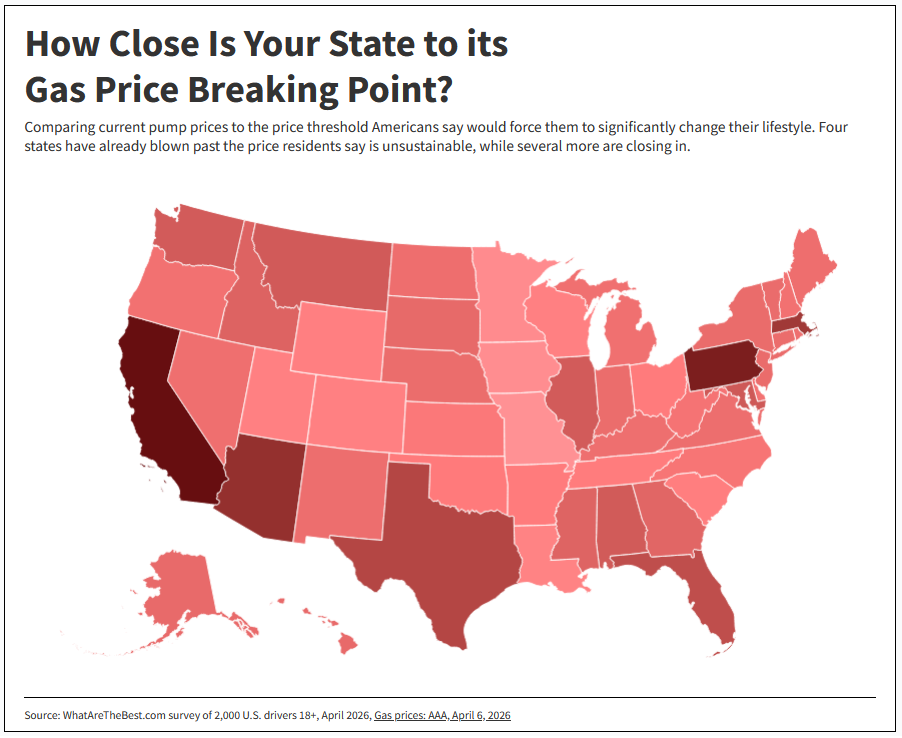
Four states have already blown past the breaking point where residents say fuel prices are simply unaffordable and will cause major disruptions in their everyday lives. California ranks first, with pump prices nearly a dollar above the threshold residents say they can absorb. Pennsylvania follows at second, Arizona third, and Massachusetts fourth, where the gap is razor-thin.
Several more states are dangerously close. Texas ranks 5th and Florida 6th, both within striking distance of crossing the line with any further price increase. On the other end of the spectrum, Iowa ranks 50th, Missouri 49th, and Minnesota 48th. These states have the most cushion before their residents reach their stated limits.

But even in the "safest" states, residents consider current prices well above what they call "affordable." That gap between what Americans consider a reasonable price and what they're actually paying is wide in every state, from the most expensive to the cheapest.
Florida ranks 6th despite not being a traditionally expensive gas market, which indicates its residents have a lower tolerance for price spikes than drivers in states where high prices have been the norm for years. Pennsylvania ranks second with the lowest median breaking point of any state in the top ten, demonstrating a population that considers even moderate prices unsustainable.
The financial pressure caused by the sudden spike in fuel costs is far reaching. According to our survey, 18.9% of drivers describe the pressure as severe, 24.1% call it significant, and 33.2% say it's moderate. Just 8.7% report feeling no impact at all. Among households earning under $25,000, 28.9% report severe financial pressure from current U.S. gas prices. Among those earning $150,000 or more, that figure drops to 9.2%. At the start of 2026, the national average was $2.81. At current prices, the average driver is spending roughly $750 more per year on gas than they were in January. For a two-car household, that's nearly $1,500.
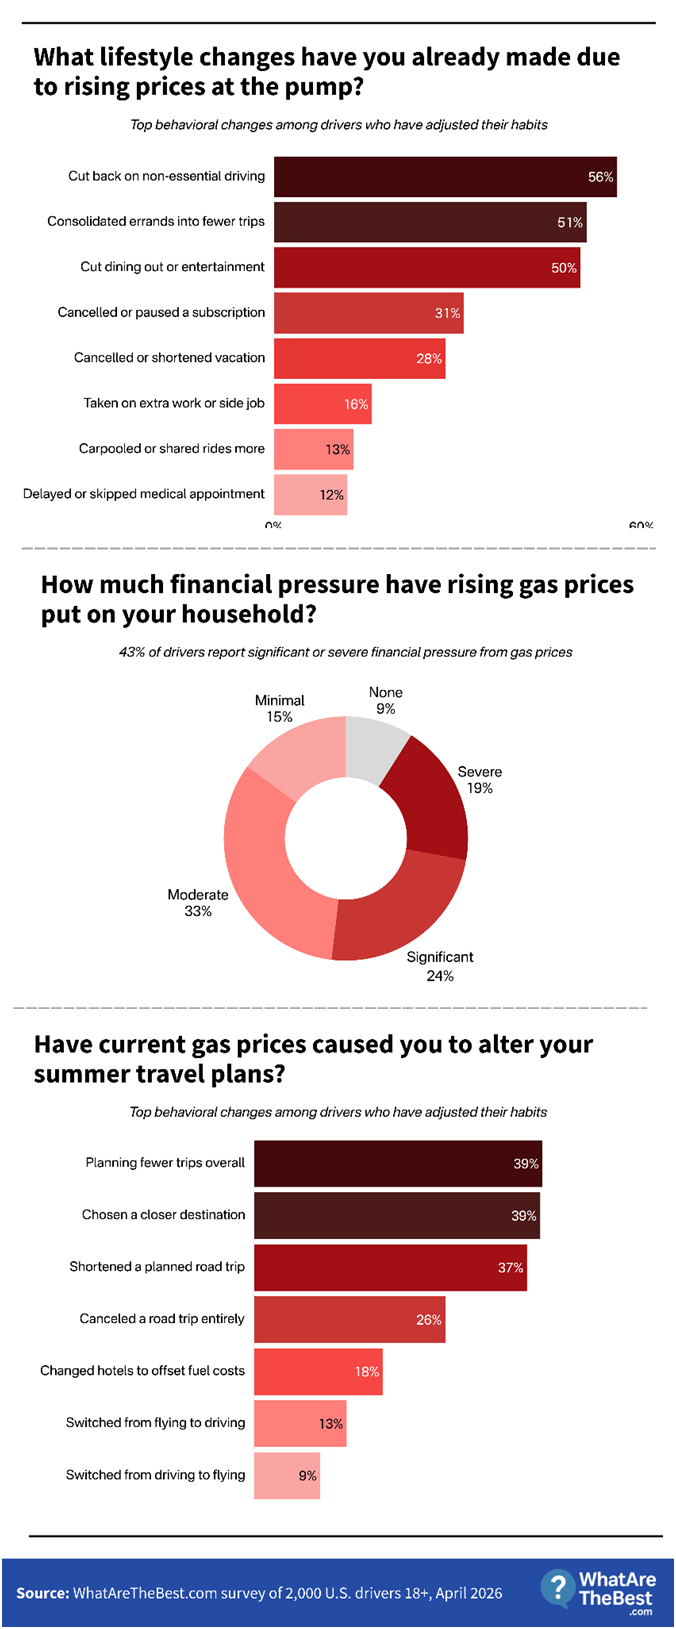
Among the 29.1% who have already changed their behavior in response, the most common adjustment is cutting back on non-essential driving (56%). Consolidating errands into fewer trips follows closely at 51% — the same efficiency problem that route planning and optimization software is built to solve — along with cutting dining out or entertainment (50%). Nearly a third (31%) have canceled or paused a subscription service. Twenty-eight percent have canceled or shortened a vacation. Sixteen percent have taken on extra work or a side job. And 12% have delayed or skipped a medical appointment.
The impact on summer travel plans is significant. Of the 44.5% whose plans have been affected, 39% are planning fewer trips overall, 39% have chosen a closer destination, and 37% have shortened a planned road trip. Twenty-six percent have canceled a road trip entirely. Eighteen percent have changed accommodations to offset fuel costs.
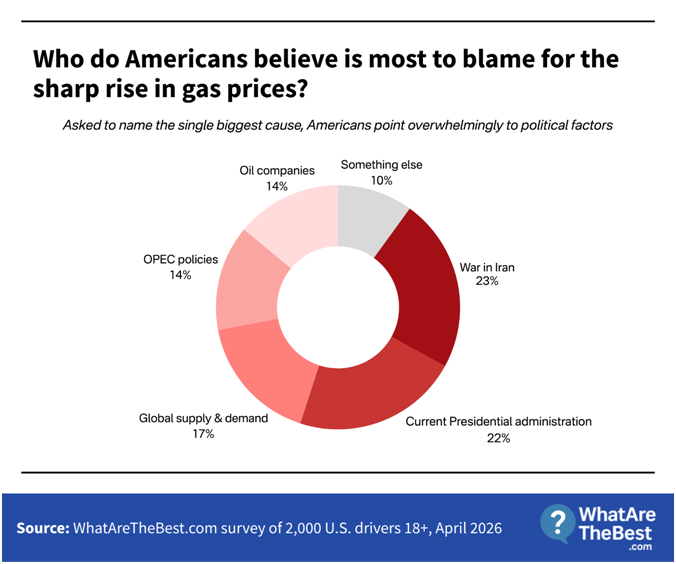
When asked to identify the single biggest driver of high gas prices, Americans pointed to two causes above all others, nearly tied. Military conflict in oil-producing regions tops the list at 23.1%, while the current presidential administration follows at 22.1%.
Global supply and demand comes in third at 16.7%, followed by OPEC production decisions at 14.1% and oil and gas companies at 13.8%. The near-even split between foreign conflict and the presidential administration is the most telling finding in this section. Americans are genuinely divided on whether to attribute the crisis to geopolitics or to political leadership at home.
The national mood is pessimistic. Seven in ten respondents (70.5%) expect gas prices in 2026 to continue to rise, at least over the next six months. Within that group, 31.9% believe prices will rise significantly (up $1.00 or more per gallon), while 38.6% predict a more moderate increase. Only 14.5% think prices will fall.
Confidence in government action is equally low. Just 8.2% of respondents are very confident the government will bring prices down. Another 22.8% are somewhat confident. The remaining 69.0% are not: 37.2% say they're not very confident, and 31.8% say not at all.
The price spike is also pushing some drivers toward electric vehicles. The most common trigger price for seriously shopping for an EV or hybrid is $5.00 per gallon (15.6% of respondents), followed closely by $5.50 (15.2%). Another 7.5% say they've already started shopping. But 29.5% say they would never consider an electric vehicle, regardless of gas prices.
Prices are still climbing, global supply remains constrained, and the data demonstrates that many Americans are already past the point they said they could handle. The gap between what people consider affordable and what they're paying is not abstract. It's showing up in canceled trips, skipped dinners, dropped subscriptions, and for some, major lifestyle changes.
This survey was conducted in April 2026 via Prolific with a nationally representative sample of 2,000 U.S. adults (40 respondents per state), weighted by age, income, and urban/rural distribution. Gas price data is sourced from AAA State Gas Price Averages and is updated regularly in the interactive table above. The breaking point threshold was collected as an open-ended dollar amount (not multiple choice). The "comfort price" representing what respondents consider affordable was selected from predefined price ranges in $.25 increments. Annual spending increase estimated using the national average of 13,500 miles driven per year at 25.4 MPG (FHWA), comparing the AAA national average of $2.81/gallon in January 2026 to current prices.
Download the full state-by-state dataset (CSV)
Media inquiries: albert@whatarethebest.com