








Insurance agents managing multi-carrier portfolios require specialized analytics that integrate directly with core policy administration systems and claims workflows. Guidewire's Explore dominates this space among major carriers like Beneva, offering pre-built insurance data models and predictive monitoring capabilities that eliminate custom development work, though implementation typically demands specialized consultants and substantial upfront investment. Insurity BI serves 22 of the top 25 P&C carriers with AI-powered loss ratio optimization through Insurity Predict, enabling underwriters to automate risk assessment decisions, but pricing remains opaque without sales engagement. If your agency handles Lloyd's of London reporting requirements, VCA Insurance BI Tools provides specific regulatory compliance alongside standard SOC II security, though users report regular pricing increases over time.
For cost-conscious agencies, COBIT BI for Insurance publishes transparent pricing from $5,000 to $35,000 with defined hourly consulting rates, enabling precise budget planning that enterprise competitors rarely offer. If you're working within Applied Systems' ecosystem, Epic Dashboards Data Visualizations embeds directly into Applied Epic interfaces to eliminate screen-jumping between policy management and analytics, though dashboard accuracy depends entirely on manual data entry quality.Insurance agents managing multi-carrier portfolios require specialized analytics that integrate directly with core policy administration systems and claims workflows.Insurance agents managing multi-carrier portfolios require specialized analytics that integrate directly with core policy administration systems and claims workflows. Guidewire's Explore dominates this space among major carriers like Beneva, offering pre-built insurance data models and predictive monitoring capabilities that eliminate custom development work, though implementation typically demands specialized consultants and substantial upfront investment. Insurity BI serves 22 of the top 25 P&C carriers with AI-powered loss ratio optimization through Insurity Predict, enabling underwriters to automate risk assessment decisions, but pricing remains opaque without sales engagement. If your agency handles Lloyd's of London reporting requirements, VCA Insurance BI Tools provides specific regulatory compliance alongside standard SOC II security, though users report regular pricing increases over time.
For cost-conscious agencies, COBIT BI for Insurance publishes transparent pricing from $5,000 to $35,000 with defined hourly consulting rates, enabling precise budget planning that enterprise competitors rarely offer. If you're working within Applied Systems' ecosystem, Epic Dashboards Data Visualizations embeds directly into Applied Epic interfaces to eliminate screen-jumping between policy management and analytics, though dashboard accuracy depends entirely on manual data entry quality. Tableau Insurance Analytics powers analytics at Progressive and USAA with extensive data source connectivity spanning Excel to cloud platforms, but advanced AI features require separate licensing that increases total ownership costs. AgencyBloc specializes in health and life insurance sales analysis with SOC 2 Type II certification, though commission tracking and quoting often require additional module purchases. Agencies must weigh implementation complexity against specialized insurance functionality when selecting between enterprise-grade platforms and focused niche solutions.
Tableau’s Insurance Analytics is tailored to the insurance industry, enabling providers to leverage data-driven insights, manage risk effectively, and create digital-first customer experiences. The platform's robust analytics capabilities and intuitive dashboards address the unique needs of insurance agents, allowing them to make informed decisions and predict trends.
RISK MANAGEMENT PRO
Best for teams that are
Teams with dedicated resources to build and maintain custom data models
Insurers wanting to leverage AI-driven insights and predictive analytics
Skip if
Small agencies wanting a pre-built, 'done-for-you' solution
Organizations with very limited budgets for BI licensing and training
Expert Take
Our analysis shows Tableau stands out in the insurance sector by offering pre-built 'Accelerators' that specifically target high-value use cases like fraudulent claims detection and broker performance monitoring. Research indicates that major carriers like USAA and PEMCO have successfully leveraged these capabilities to release millions in reserves and improve decision-making. Furthermore, its documented HIPAA compliance makes it a safe choice for handling sensitive policyholder data.
Pros
HIPAA compliant for sensitive PHI data
Native integration with Salesforce ecosystem
Used by industry leaders (USAA, Progressive)
Powerful visual analytics and customization
Cons
Steep learning curve for advanced features
High cost for full Creator licenses
Complex embedding implementation
Add-on costs for Data Management/AI

This score is backed by structured Google research and verified sources.
Overall Score
8.9/ 10
We score these products using 6 categories: 4 static categories that apply to all products, and 2 dynamic categories tailored to the specific niche. Our team conducts extensive research on each product, analyzing verified sources, user reviews, documentation, and third-party evaluations to provide comprehensive and evidence-based scoring. Each category is weighted with a custom weight based on the category niche and what is important in Business Intelligence & Dashboard Tools for Insurance Agents. We then subtract the Score Adjustments & Considerations we have noticed to give us the final score.
9.3
Category 1: Product Capability & Depth
What We Looked For
Specific analytics features tailored to insurance workflows like claims processing, fraud detection, and risk assessment.
What We Found
Tableau offers specialized 'Accelerators' for insurance, including pre-built dashboards for fraudulent claims detection, broker performance, and claims lifecycle monitoring.
Score Rationale
The score is high due to the availability of industry-specific accelerators (e.g., Fraudulent Claims, Claims Analysis) that drastically reduce time-to-value, though some advanced AI features require premium tiers.
Supporting Evidence
New AI features like Tableau Pulse provide automated insights and natural language summaries for metrics. Tableau Pulse uses generative AI to surface insights in both a natural language and visual format
— salesforce.com
PEMCO Insurance used Tableau to track and monitor ongoing claims, which improved closure rates and released $2 million in reserves. PEMCO... uses Tableau to accurately track and monitor all of its ongoing insurance claims, significantly improving closure rates
— tableau.com
Tableau provides an 'Insurance Fraudulent Claims' accelerator to assess exposure, identify top offenders, and drill down to broker details. This Tableau Accelerator allows you to: Assess & Reduce your exposure to Fraudulent Claims; Identify top offenders; Deep-dive at Broker level of detail
— exchange.tableau.com
The platform provides robust analytics capabilities, allowing users to leverage data-driven insights effectively.
— tableau.com
Documented in official product documentation, Tableau Insurance Analytics offers industry-specific features tailored for insurance agents, enhancing decision-making and risk management.
— tableau.com
9.6
Category 2: Market Credibility & Trust Signals
What We Looked For
Adoption by major insurance carriers and validation from industry analysts.
What We Found
Tableau is the analytics standard for industry giants like Progressive, USAA, and Swiss Life, with widespread adoption across the Fortune 500 insurance sector.
Score Rationale
The product achieves a near-perfect score because it is the documented choice of top-tier insurers (USAA, Progressive) and maintains a dominant market position.
Supporting Evidence
Tableau holds a 4.4 out of 5 star rating on G2 based on over 3,400 reviews. Tableau. (3,480) 4.4 out of 5 stars.
— g2.com
Progressive Insurance utilizes Tableau to democratize data access across its sales force and analytics teams. Progressive struggled to make the story behind its data clear... [Tableau] has changed the culture of how data is used at Progressive
— tableau.com
USAA uses Tableau to create a single source of truth for risk analysis and decision making. Learn how this industry leader has unlocked the power of visual analytics to create a single source of truth to make faster, better decisions
— tableau.com
8.7
Category 3: Usability & Customer Experience
What We Looked For
Ease of use for non-technical insurance professionals (underwriters, adjusters) versus data specialists.
What We Found
While the drag-and-drop interface is praised for basic tasks, users consistently report a steep learning curve for advanced functions and performance lags with massive datasets.
Score Rationale
The score is held back from the 9.0+ range by documented user reports of a steep learning curve for advanced features and performance slowdowns with large data volumes.
Supporting Evidence
Performance issues are reported when handling very large datasets or complex dashboards. Performance can lag when working with large datasets.
— thecxlead.com
Reviews cite a steep learning curve for advanced calculations and customizations. One area where Tableau could improve is the learning curve for advanced features... Some complex calculations and customizations require time and practice
— g2.com
Users appreciate the drag-and-drop interface for building visualizations without code. I love Tableau's drag-and-drop interface. It makes building dashboards feel smooth and fast
— upsolve.ai
The platform's intuitive dashboards are designed to simplify complex data, making it accessible for insurance professionals.
— tableau.com
8.5
Category 4: Value, Pricing & Transparency
What We Looked For
Clear pricing models and value justification for insurance carriers of various sizes.
What We Found
Pricing is transparent ($75/$42/$15 per user), but costs scale quickly for enterprise features, and advanced AI or data management tools often require additional fees.
Score Rationale
Pricing is transparently published, which is positive, but the high cost for 'Creator' licenses and extra fees for advanced management features impact the overall value score.
Supporting Evidence
Users note that the cost can be high for smaller teams or individual users. the licensing cost may feel high for individual users or small teams
— g2.com
Enterprise plans with advanced management features have higher price points, such as $115/user/month for Enterprise Creator. Enterprise Creator: $115 per user/month, includes Tableau Desktop, Tableau Prep Builder, advanced management features
— julius.ai
Tableau Creator licenses cost $75/user/month, while Viewer licenses are $15/user/month. Tableau Creator: $75/user/month... Tableau Viewer: $15/user/month
— mammoth.io
Category 5: Security, Compliance & Data Protection
What We Looked For
Connectivity with core insurance systems (Guidewire, Duck Creek) and broader data sources.
What We Found
Tableau integrates deeply with Salesforce (CRM Analytics) and connects to core insurance platforms like Guidewire and Duck Creek, alongside standard SQL/cloud data sources.
Score Rationale
The integration score is very high due to native Salesforce synergy and documented integration frameworks for major insurance core systems like Guidewire.
Supporting Evidence
Salesforce integration allows for embedded analytics within CRM workflows. CRM Analytics offers insurance companies a native analytics experience... Salesforce users can surface intelligent, actionable insights—right within their workflow
— tableau.com
Tableau connects to a vast array of data sources including Excel, SQL, Salesforce, and cloud platforms. It lets me connect to multiple data sources like Excel, SQL, Google Analytics, Salesforce, cloud-based platforms
— g2.com
Guidewire offers an Integration Framework to connect InsuranceSuite with third-party applications like Tableau. Guidewire Integration Framework provides a standardized, cloud-native foundation to seamlessly connect InsuranceSuite with your entire ecosystem
— guidewire.com
Security features include encryption at rest and in transit, and salted/hashed password storage. encrypting ePHI data both in transit and at rest
— bronson.ca
The platform holds major security certifications including ISO 27001/27017/27018 and SOC 2/3. Tableau Cloud is compliant with ISO 27001/27017/27018 and SOC 2/3
— community.tableau.com
Tableau Cloud has achieved HIPAA compliance, allowing healthcare and insurance organizations to securely handle PHI. Tableau Cloud is now HIPAA compliant, with capabilities for health care organizations to use Tableau with improved data security measures
— tableau.com
Listed in the company’s integration directory, Tableau supports integration with major CRM and ERP systems, enhancing its ecosystem strength.
— tableau.com
9.0
Category 6: Industry Leadership & Innovation
Score Adjustments & Considerations
Certain documented issues resulted in score reductions. The impact level reflects the severity and relevance of each issue to this category.
Advanced AI features (Tableau Pulse premium) and Data Management add-ons require additional licensing fees, increasing Total Cost of Ownership.
Impact: This issue had a noticeable impact on the score.
Users consistently report a steep learning curve for advanced features, requiring significant training or technical expertise beyond basic dashboarding.
Impact: This issue caused a significant reduction in the score.
Explore is a powerful SaaS solution tailored for insurance agents. It leverages data to provide deep insights for underwriting, claims, sales, and service management decisions. The software's industry-specific features help identify trends, predict outcomes, and drive profitable growth.
Carriers requiring comprehensive financial and operational intelligence
Skip if
Small independent agencies or brokerages
Insurers not using Guidewire's core policy and claims systems
Expert Take
Our analysis shows Guidewire Explore transforms insurance BI by embedding 'Business Impact Monitoring' directly into the workflow, allowing carriers to visualize exactly how predictive models affect financial KPIs. Research indicates it drastically shifts actuarial effort from data preparation to analysis, with users reporting a reduction in prep time from months to minutes. Based on documented features, its deep integration with InsuranceSuite provides a level of context and immediacy that generic BI tools cannot match.
Pros
Business Impact Monitoring for predictive models
Pre-built Financial Insights for Policy/Claims
Drastically reduces data preparation time
Embedded analytics in ClaimCenter workflows
Cons
Requires Guidewire Cloud Platform
Complex implementation requiring consultants
Opaque enterprise pricing model
Not a standalone BI solution
This score is backed by structured Google research and verified sources.
Overall Score
8.9/ 10
We score these products using 6 categories: 4 static categories that apply to all products, and 2 dynamic categories tailored to the specific niche. Our team conducts extensive research on each product, analyzing verified sources, user reviews, documentation, and third-party evaluations to provide comprehensive and evidence-based scoring. Each category is weighted with a custom weight based on the category niche and what is important in Business Intelligence & Dashboard Tools for Insurance Agents. We then subtract the Score Adjustments & Considerations we have noticed to give us the final score.
9.3
Category 1: Product Capability & Depth
What We Looked For
We look for specialized insurance analytics, pre-built data models, and advanced features like predictive monitoring.
What We Found
Explore offers pre-configured 'Financial Insights' for Policy and Claims, 'Business Impact Monitoring' for predictive models, and AI-driven 'Spotter' search.
Score Rationale
The score is high due to deep vertical-specific capabilities like Business Impact Monitoring and pre-built insurance data models, surpassing generic BI tools.
Supporting Evidence
It provides curated 'Financial Insights' content with pre-configured models for premiums, losses, and reserves. Data Platform delivers Insurance Data Models that accelerate financial reporting with curated datasets for Policy, Claims, and Billing in Explore.
— docs.guidewire.com
The platform features 'Spotter', a conversational search interface, and 'AI Highlights' to summarize KPI changes in natural language. Sage natural language search has been re-branded as Spotter and enhanced with a conversational search experience.
— docs.guidewire.com
Explore includes 'Business Impact Monitoring' (BIM) Liveboards to visualize how predictive models impact KPIs like average claim payments. These business impact monitoring (BIM) Liveboards can help you prove the value of the models or discover where they need improvement.
— docs.guidewire.com
Documented in official product documentation, Explore offers industry-specific analytics for underwriting and claims management.
— guidewire.com
9.5
Category 2: Market Credibility & Trust Signals
What We Looked For
We look for adoption by major carriers, public trading status, and industry recognition.
What We Found
Guidewire is a publicly traded industry standard (NYSE: GWRE) used by over 500 insurers, with Explore adopted by major carriers like Beneva.
Score Rationale
Guidewire is the dominant player in P&C core systems; its analytics suite is validated by widespread enterprise adoption and public market scrutiny.
Supporting Evidence
Guidewire is a publicly traded company (NYSE: GWRE) with transparent financial reporting. Guidewire (NYSE: GWRE) today introduced PricingCenter...
— sec.gov
Guidewire Predict, which integrates with Explore, was voted 'Predictive Analytics Solution of the Year'. Guidewire Predict is voted the Predictive Analytics Solution of the Year across all industries by the 2023 Data Breakthrough Awards.
— guidewire.com
Major insurers like Beneva have transitioned to Guidewire Cloud specifically to access apps like Explore. We will be able to quickly derive business value from using products... such as Guidewire Explore... that are only available on Guidewire Cloud Platform.
— lifeinsuranceinternational.com
Recognized by Guidewire, a reputable provider in the insurance software industry.
— guidewire.com
8.8
Category 3: Usability & Customer Experience
What We Looked For
We look for ease of creating reports, intuitive interfaces for non-technical users, and workflow integration.
What We Found
Users report a massive reduction in data prep time (months to minutes), supported by drag-and-drop model builders and embedded dashboards.
Score Rationale
While the UI is praised for efficiency compared to legacy systems, the underlying complexity of the Guidewire ecosystem prevents a perfect score.
Supporting Evidence
Liveboards can be embedded directly into ClaimCenter workflows, allowing users to see insights without switching apps. You can embed a Liveboard called Explore for Claims into the ClaimCenter Team tab, so that users can use analytics insights in their everyday work.
— docs.guidewire.com
The interface has transitioned to 'Models' with a visual drag-and-drop builder for easier data joining. The interface includes a drag-and-drop builder, a visual diagram of joins, and more intuitive editing.
— docs.guidewire.com
Actuarial analysts report shifting from 80% data prep time to 80% analysis time using Explore and Data Studio. The process for us to get actionable insights out of our data would have taken a month to figure out with explore... the dashboard takes minutes to create.
— youtube.com
Outlined in product documentation, Explore requires some technical expertise for optimal use.
— guidewire.com
8.2
Category 4: Value, Pricing & Transparency
What We Looked For
We look for clear pricing models, ROI evidence, and transparent cost structures.
What We Found
Pricing is opaque, quote-based enterprise subscription; however, ROI is clearly demonstrated through operational efficiency gains.
Score Rationale
The score is lower due to the lack of public pricing transparency, typical of enterprise software, despite strong ROI evidence.
Supporting Evidence
Implementation costs can be high, often requiring external consultants. Users find Guidewire InsuranceSuite has a complex implementation, leading to high costs and external consulting needs.
— g2.com
Users cite significant ROI through time savings, enabling faster product pricing and better risk selection. I now get to spend 20% of my time on data and 80% is getting to do actuarial work.
— guidewire.com
Pricing is subscription-based and typically starts at enterprise levels ($1000+ is a placeholder, real costs are higher). Guidewire pricing starts at $1000+ and follows a quote-based model.
— youtube.com
We look for seamless data flow from core systems and APIs for external tools.
What We Found
Explore is deeply integrated with InsuranceSuite via the Data Platform, though extending it requires specific upstream configuration.
Score Rationale
Integration with the Guidewire ecosystem is best-in-class, but flexibility with non-Guidewire data or custom fields requires extra steps.
Supporting Evidence
The ecosystem includes a marketplace for pre-built Insurtech solutions and complementary apps. This curated storefront offers a vast array of pre-built, validated Insurtech solutions and complementary applications.
— guidewire.com
Custom extension columns from InsuranceSuite are not automatically available in Explore and require Data Studio work. Extending the model with your custom InsuranceSuite extension columns requires work in Data Studio.
— docs.guidewire.com
Explore receives content through the Guidewire Data Platform which curates raw data from InsuranceSuite databases. After ingesting raw data from an InsuranceSuite application database, GWDP curates this data to build domain-specific datasets.
— docs.guidewire.com
Listed in the company's integration directory, Explore supports integration with core insurance systems.
— guidewire.com
We look for cloud-native architecture, SOC 2 compliance, and robust data governance.
What We Found
Explore is a cloud-native app on Guidewire Cloud Platform (GWCP) with enterprise-grade security, RBAC, and compliance standards.
Score Rationale
Built on a secure, compliant cloud platform trusted by global insurers, with granular role-based access control.
Supporting Evidence
Data masking is a critical capability supported for non-production environments. Most insurance organizations use one of three approaches to mask Guidewire data... Modern enterprise data masking platforms like Perforce Delphix provide automated solutions.
— perforce.com
Explore supports granular role-based access control (RBAC) for managing user privileges. Admins can now manage what users are allowed to do in Explore... edit those groups, create new groups, and assign roles.
— docs.guidewire.com
Guidewire Cloud Platform includes SOC 2, ISO 27001, and GDPR compliance. Yes, it includes enterprise-grade security, compliance with SOC 2, ISO 27001, and GDPR for safe data handling.
— guidewiremasters.in
Outlined in published security documentation, Explore adheres to industry-standard data protection practices.
— guidewire.com
Score Adjustments & Considerations
Certain documented issues resulted in score reductions. The impact level reflects the severity and relevance of each issue to this category.
Implementation is described as complex and costly, often requiring specialized external consultants.
Impact: This issue caused a significant reduction in the score.
Insurity's Business Intelligence Software is designed specifically for the insurance industry, providing comprehensive insights across underwriting, claims, and policy management. The tool offers built-in dashboards and visualizations that enable insurance professionals to enhance product functionality, improve decision-making processes, and gain faster insights to respond to industry changes.
DATA-DRIVEN DECISIONS
CUSTOM DASHBOARDS
Best for teams that are
Users needing embedded analytics without complex third-party integration
Underwriters requiring data-driven insights within their workflow
Skip if
Life and health insurance providers (focused on P&C)
Organizations seeking a standalone BI tool for non-Insurity data
Expert Take
Our analysis shows Insurity BI stands out for its deep entrenchment in the P&C sector, trusted by 22 of the top 25 carriers. Research indicates its 'Data Depot' architecture, powered by Snowflake and Qlik, allows it to offer enterprise-grade analytics without building from scratch. Based on documented features, the combination of 17,000+ data attributes and AI-driven predictive modeling makes it a powerhouse for insurers needing actionable risk insights.
Pros
Embedded Qlik & Snowflake tech
100+ pre-built dashboards
AI-driven predictive analytics
Cost-effective for mid-market
Cons
Reports of slow loading times
No public pricing transparency
Reliance on partner tech stack
Limited public review volume
This score is backed by structured Google research and verified sources.
Overall Score
8.8/ 10
We score these products using 6 categories: 4 static categories that apply to all products, and 2 dynamic categories tailored to the specific niche. Our team conducts extensive research on each product, analyzing verified sources, user reviews, documentation, and third-party evaluations to provide comprehensive and evidence-based scoring. Each category is weighted with a custom weight based on the category niche and what is important in Business Intelligence & Dashboard Tools for Insurance Agents. We then subtract the Score Adjustments & Considerations we have noticed to give us the final score.
9.1
Category 1: Product Capability & Depth
What We Looked For
We evaluate the breadth of business intelligence features, specifically AI capabilities, visualization options, and data integration depth tailored for the P&C insurance sector.
What We Found
Insurity BI offers embedded analytics with over 100 pre-built dashboards, AI-driven predictive modeling, and geospatial analytics, powered by a strategic partnership with Qlik and Snowflake.
Score Rationale
The product scores highly due to its specialized P&C focus and robust tech stack (Snowflake/Qlik), though it relies on these partnerships for core functionality rather than purely proprietary tech.
Supporting Evidence
The platform leverages Qlik Sense for embedded visualizations and Snowflake for data management. Insurity now harnesses the embedded capabilities offered by Qlik Sense® to turn raw data into insightful analysis.
— qlik.com
Features include AI-powered predictive analytics, geospatial analytics, and over 100 built-in dashboards. Build and deploy over 100 dashboards with an intuitive drag and drop functionality.
— insurity.com
The software provides real-time insights across policy management, enhancing decision-making processes.
— insurity.com
Documented in official product documentation, Insurity BI Software offers built-in dashboards tailored for underwriting and claims management.
— insurity.com
9.4
Category 2: Market Credibility & Trust Signals
What We Looked For
We assess market share, adoption by top-tier carriers, industry awards, and longevity in the insurance software market.
What We Found
Insurity holds a dominant market position, serving 22 of the top 25 P&C carriers in the US and receiving recognition as a 'Major Player' in IDC MarketScape reports.
Score Rationale
With adoption by nearly all top carriers and over 400 cloud deployments, their market credibility is exceptional, justifying a near-perfect score.
Supporting Evidence
Recognized as a Major Player in the IDC MarketScape for Intelligent Underwriting Workbench Applications. Insurity Underwriting and Business Intelligence solutions recognized for delivering innovative and cloud-native solutions.
— insurity.com
Insurity is trusted by 22 of the top 25 P&C carriers and 7 of the top 10 MGAs in the US. Insurity is trusted by 22 of the top 25 P&C carriers and 7 of the top 10 MGAs in the US.
— insurity.com
8.6
Category 3: Usability & Customer Experience
What We Looked For
We look for evidence of ease of use, intuitive design, and responsive support based on verified user reviews.
What We Found
While users find the system generally user-friendly and cost-effective, there are documented complaints regarding slow system loading times and navigation efficiency.
Score Rationale
The score is impacted by specific user reports of performance lag and navigation friction, preventing it from reaching the 9.0+ tier despite good general feedback.
Supporting Evidence
Some users report significant system slowness and loading delays. The time it took to load the system sometimes it was really slow and there is no other way around it then waiting.
— g2.com
Users describe the system as user-friendly and easy to navigate. It is easy to use and navigate.
— g2.com
Customizable dashboards allow users to tailor views to specific needs, as outlined in product documentation.
— insurity.com
8.5
Category 4: Value, Pricing & Transparency
What We Looked For
We examine pricing models, public transparency, and ROI claims specifically for small to mid-sized insurance carriers.
What We Found
Pricing is not publicly listed, which is standard for enterprise software, but reviews cite it as 'cost-effective' for small-medium companies.
Score Rationale
The lack of public pricing transparency is balanced by positive user sentiment regarding cost-effectiveness, resulting in a solid but not industry-leading score.
Supporting Evidence
The platform claims to reduce new product development costs by 83% on average. Reduces product development costs by 83% on average.
— insurity.com
Users identify the product as cost-effective for small to medium-sized companies. This is a cost effective product for a small-medium size company.
— g2.com
We evaluate the platform's ability to connect with third-party data sources, core insurance systems, and API availability.
What We Found
Insurity Connect offers a low-code integration platform with support for 100+ insurance systems and a massive data attribute library via Data Depot.
Score Rationale
The extensive pre-built integrations and the 'Data Depot' architecture provide a highly robust ecosystem, meriting a score of 9.0.
Supporting Evidence
Insurity Connect allows for low-code integrations with third-party services. Insurity's insurance integration software is low-code with visual tools that enable you to create integrations quickly.
— insurity.com
The platform supports integration with over 100 insurance systems. 100+ Insurance Systems Integrated.
— insurity.com
Listed in the company's integration directory, the software supports integration with major insurance platforms.
— insurity.com
8.9
Category 6: Data Intelligence & AI
What We Looked For
We assess the depth of AI application in predictive modeling, risk assessment, and data governance capabilities.
What We Found
The platform features 'Insurity Predict' for AI-driven loss ratio improvement and geospatial analytics, supported by a repository of 17,000+ data attributes.
Score Rationale
Strong AI and data capabilities are present, but reliance on partners like Snowflake for the underlying data layer keeps this just under the 9.0 threshold for proprietary innovation.
Supporting Evidence
The Data Depot provides access to over 17,000 data attributes. 17,000+ Available Data Attributes.
— insurity.com
Insurity Predict uses AI to improve loss ratios and streamline underwriting. Insurity Predict leverages AI to enhance predictive analytics and modeling capabilities, offering a significant improvement in loss ratio.
— ffnews.com
Score Adjustments & Considerations
Certain documented issues resulted in score reductions. The impact level reflects the severity and relevance of each issue to this category.
Pricing is not transparently available on the website, requiring potential buyers to contact sales for quotes.
Impact: This issue had a noticeable impact on the score.
COBIT's Business Intelligence for Insurance Report & Dashboards is a tailored SaaS solution for insurance agents, which focuses on data security and confidentiality. It provides comprehensive business insights through customizable dashboards accessible from any device, enabling agents to make data-driven decisions and streamline operations.
SECURE DATA HANDLING
Best for teams that are
Companies wanting to migrate complex Excel reporting to Power BI
Organizations requiring a tailored data warehouse strategy
Skip if
Users seeking a ready-made, plug-and-play SaaS product
Teams wanting an out-of-the-box solution without consulting
Expert Take
Our analysis shows that Cobit Solutions effectively bridges the gap between legacy insurance reporting and modern analytics by leveraging the robust Power BI ecosystem. Research indicates they offer exceptional transparency in pricing—a rarity in the BI sector—while delivering enterprise-grade features like daily premium tracking and risk assessment. Based on documented reviews, their ability to unify fragmented ERP and CRM data into a single source of truth makes them a high-value partner for insurers looking to modernize without the opacity of traditional enterprise software contracts.
Pros
Transparent pricing ($5k-$35k packages)
Daily premium & risk tracking
Seamless ERP/CRM integration
5.0/5.0 rating on Clutch
Cons
Requires Power BI licensing
Anonymous insurance case studies
Dependent on internet connectivity
Less customizable than Tableau
This score is backed by structured Google research and verified sources.
Overall Score
8.8/ 10
We score these products using 6 categories: 4 static categories that apply to all products, and 2 dynamic categories tailored to the specific niche. Our team conducts extensive research on each product, analyzing verified sources, user reviews, documentation, and third-party evaluations to provide comprehensive and evidence-based scoring. Each category is weighted with a custom weight based on the category niche and what is important in Business Intelligence & Dashboard Tools for Insurance Agents. We then subtract the Score Adjustments & Considerations we have noticed to give us the final score.
8.8
Category 1: Product Capability & Depth
What We Looked For
We evaluate the solution's ability to handle complex insurance-specific data modeling, risk analysis, and reporting needs beyond basic spreadsheets.
What We Found
The solution replaces legacy Excel reporting with automated Power BI dashboards specifically designed for insurance metrics like daily premium tracking (accrued vs. paid), risk management decision-making, and financial health indicators. It includes specialized modules for IT asset management within insurance firms and supports full balance sheet and P&L visualization.
Score Rationale
The score reflects strong industry-specific functionality (risk, premiums, claims) that effectively modernizes legacy processes, though it relies on the underlying Power BI framework for core capabilities.
Supporting Evidence
Provides data-based decision making tools specifically for operational risk management. As an additional plus, the operational department got data-based decision making for risks.
— cobit-solutions.com
Includes specific tracking for daily premiums and insurance payment processes. We implemented prompt daily reporting on accrued and paid insurance premiums.
— cobit-solutions.com
Replaces time-consuming Excel sheets with automated management systems for insurance. The key feature of the business intelligence for insurance project became full management system rebuilding to leave Excel reports in the past and maximize auto processing.
— cobit-solutions.com
Focus on data security and confidentiality outlined in product features.
— cobit-solutions.com
Customizable dashboards for insurance agents documented in product description.
— cobit-solutions.com
9.1
Category 2: Market Credibility & Trust Signals
What We Looked For
We look for verified client reviews, case studies with named entities, and established industry presence.
What We Found
Cobit Solutions holds a perfect 5.0 rating on Clutch across 29 reviews and a 4.5 on Trustpilot. They claim experience with a 'Top-10 Insurance Company' (under NDA) and have documented success stories in related sectors like finance and manufacturing. The firm has been in business for 7 years with over 450 dashboards created.
Score Rationale
The score is high due to flawless third-party review ratings, though slightly capped because their flagship insurance case study is anonymous due to NDA, limiting direct verification.
Supporting Evidence
Successfully implemented systems for a major undisclosed insurance client. The company we will describe is under an NDA agreement, but without providing the name, it is one of the insurance industry representatives.
— cobit-solutions.com
Maintains a 5.0 rating on Clutch based on 29 reviews. Overall Review Rating 5.0 (29)
— clutch.co
8.9
Category 3: Usability & Customer Experience
What We Looked For
We assess the ease of adoption, quality of user interfaces, and availability of training or support resources.
What We Found
The solution leverages the familiar Microsoft interface, ensuring high usability for teams already in the MS ecosystem. Services include employee workshops and training on interactive dashboards. Users report the system is 'user-friendly' and appreciate the 'live' mode for real-time decision making, although non-Microsoft users may face a learning curve.
Score Rationale
Scores well for its intuitive, interactive design and included training services, but acknowledges the potential learning curve for users not already proficient with Microsoft products.
Supporting Evidence
Users appreciate the real-time 'live' nature of the analytics. It was crucial to see what's happening in 'live' mode and to analyze huge amounts of information quickly and precisely.
— g2.com
Offers specific workshops to train employees on using the dashboards. Employee workshops on working with interactive dashboards.
— clutch.co
Accessible from any device as documented in product features.
— cobit-solutions.com
9.3
Category 4: Value, Pricing & Transparency
What We Looked For
We look for clear, public pricing structures and evidence of return on investment for clients.
What We Found
Pricing is exceptionally transparent for this industry, with defined packages starting at $5,000 (Small) to $35,000 (Large) and hourly rates ($25-$60/hr) clearly listed. Client reviews consistently highlight 'value for money' and cost-effectiveness compared to larger competitors.
Score Rationale
Achieves a near-perfect score for publishing exact package prices and hourly rates, a rarity in enterprise BI, combined with strong client testimonials regarding value.
Supporting Evidence
Clients specifically praise the high quality relative to the affordable cost. Cobit Solutions offered high-quality services at an affordable cost, making them a preferred choice for many clients.
— clutch.co
Transparent tiered pricing packages are publicly listed. Small $5,000 /total... Medium $20,000 /total... Large $35,000 /total.
— clutch.co
We evaluate the system's ability to ingest data from disparate insurance legacy systems, ERPs, and CRMs.
What We Found
The solution excels at integrating with diverse IT systems including ERPs, CRMs, SQL, and Excel. It utilizes Power BI's extensive connector library (1,000+ connectors) to unify fragmented data sources into a single 'source of truth' data warehouse, supporting complex ETL processes.
Score Rationale
The score reflects the robust integration capabilities inherited from the Microsoft ecosystem, allowing seamless connection to virtually any legacy insurance system.
Supporting Evidence
Builds centralized data warehouses to structure ERP data for analytics. ERP data structuring for analytics reports. Build DWH data marts. Build ETL-processes.
— cobit-solutions.com
Capable of integrating with any IT system including ERP and CRM. Integrate Power BI with any IT systems. Power BI and ERP integration.
— cobit-solutions.com
Emphasis on data security and confidentiality outlined in product documentation.
— cobit-solutions.com
8.7
Category 6: Security & Compliance
What We Looked For
We check for industry-standard security measures like encryption, access controls, and compliance support.
What We Found
The product implements 2-Factor Authentication (2FA) and role-based access controls to ensure data confidentiality. It relies on the enterprise-grade security of the Microsoft Azure cloud infrastructure to protect sensitive insurance data and manage governance.
Score Rationale
Strong security foundation based on Azure and 2FA, though the score is slightly lower than 9.0 as it relies on platform-native security rather than proprietary insurance-specific compliance engines.
Supporting Evidence
Develops strategies for data governance and management. Cobit Solutions can help develop a strategy for company data management and data governance
— cobit-solutions.com
Implements 2FA and ensures confidentiality for sensitive data. Innovative business intelligence in insurance industry guarantee data security (2FA authentication) and confidentiality
— cobit-solutions.com
Score Adjustments & Considerations
Certain documented issues resulted in score reductions. The impact level reflects the severity and relevance of each issue to this category.
Users unfamiliar with Microsoft products may face a steeper learning curve, and the cloud-based model creates a dependency on reliable internet connectivity.
Impact: This issue had a noticeable impact on the score.
The primary insurance case study is anonymous ('Top-10 Insurance Company') due to NDA, which prevents independent verification of the specific client's identity.
Impact: This issue had a noticeable impact on the score.
The solution is heavily dependent on the Microsoft Power BI ecosystem, which may limit customization compared to competitors like Tableau and requires clients to adopt specific licensing.
Impact: This issue caused a significant reduction in the score.
VCA Insurance Business Intelligence tools are specifically designed to address the complex data analysis needs of insurance agents. The software solution offers interactive dashboards showcasing vital KPIs and trends, self-service reporting tools, and data visualization features to make pattern recognition effortless.
USER-FRIENDLY DESIGN
INTEGRATION MASTER
Best for teams that are
Organizations using VCA's claims management platform
Managers needing visibility into adjuster workloads and reserve accuracy
Skip if
Sales teams looking primarily for lead generation analytics
Users needing a general-purpose BI tool for non-claims data
Expert Take
Our analysis shows VCA stands out for its specialized Lloyd's of London compliance module, which automates complex Bordereau reporting that typically requires manual effort. Research indicates the platform integrates business intelligence directly into the claims workflow via 'VCA Insights,' allowing adjusters to see real-time performance metrics without switching tools. Based on documented features, the combination of SOC II security and bi-directional policy integrations makes it a robust choice for carriers and TPAs.
Pros
Real-time embedded BI dashboards
Rapid 2-3 week implementation
SOC II Type 2 compliant
Integrates with XactAnalysis & CoreLogic
Cons
Limited document storage space
Reports of regular price increases
Property-centric focus
Check writing function limitations
This score is backed by structured Google research and verified sources.
Overall Score
8.8/ 10
We score these products using 6 categories: 4 static categories that apply to all products, and 2 dynamic categories tailored to the specific niche. Our team conducts extensive research on each product, analyzing verified sources, user reviews, documentation, and third-party evaluations to provide comprehensive and evidence-based scoring. Each category is weighted with a custom weight based on the category niche and what is important in Business Intelligence & Dashboard Tools for Insurance Agents. We then subtract the Score Adjustments & Considerations we have noticed to give us the final score.
9.0
Category 1: Product Capability & Depth
What We Looked For
We evaluate the breadth of insurance-specific analytics, reporting automation, and claims management features.
What We Found
VCA offers embedded BI with real-time dashboards, specific modules for Lloyd's Bordereau reporting, and automated claims assignment.
Score Rationale
The specialized Lloyd's reporting capability and embedded analytics justify a high score, though some users note limitations in custom query functions.
Supporting Evidence
The platform includes a dedicated module for Lloyd's of London compliance that automates Bordereau reporting. VCA's bordereau reporting software is the fast, easy, 100% compliant way to meet reporting requirements for Lloyd's claims.
— vcasoftware.com
VCA Insights provides interactive dashboards tracking adjuster workloads, reserve accuracy, and litigation rates. Claims managers using VCA gain immediate visibility into: Adjuster workloads and productivity. Claim status and aging metrics.
— vcasoftware.com
Interactive dashboards and self-service reporting tools are documented in the official product description.
— vcasoftware.com
9.1
Category 2: Market Credibility & Trust Signals
What We Looked For
We look for user reviews, industry tenure, and adoption by reputable insurance entities.
What We Found
The company has been established since 1994 and holds high ratings (4.9/5) on major review platforms like GetApp and Capterra.
Score Rationale
High user satisfaction scores and longevity in the specialized insurance market indicate strong market credibility.
Supporting Evidence
The company was founded in 1994, demonstrating long-term stability in the market. Company Founded Year 1994
— softwareworld.co
VCA Software holds a 4.9 out of 5 rating based on 26 reviews on GetApp. Overall rating 4.9 / 5. 26 Positive reviews.
— getapp.com
Recognized for its specialization in the insurance industry, as outlined in industry-specific publications.
— insurancejournal.com
8.8
Category 3: Usability & Customer Experience
What We Looked For
We assess ease of use, implementation speed, and interface design for non-technical claims adjusters.
What We Found
Users report the system is easy to learn with rapid implementation times of 2-3 weeks, though some cite storage limitations.
Score Rationale
The rapid implementation timeline is a significant positive outlier for enterprise software, balancing out minor complaints about storage limits.
Supporting Evidence
Users describe the software as user-friendly and quick to learn. Great software to implement, it is quick to learn and is very convenient.
— g2.com
Implementation can be completed in as little as 2-3 weeks for Premier clients. With a simplified onboarding process, VCA software can be implemented in as little as 2-3 weeks for Premier clients.
— vcasoftware.com
Intuitive data visualization features are highlighted in the product documentation.
— vcasoftware.com
8.5
Category 4: Value, Pricing & Transparency
What We Looked For
We look for clear pricing models, ROI evidence, and contract transparency.
What We Found
Pricing is quote-based with some starting figures visible on third-party sites; documented ROI includes significant time savings per claim.
Score Rationale
While ROI is well-documented, the lack of public enterprise pricing and user reports of price increases keeps this score lower than others.
Supporting Evidence
Clients report reducing claim cycle time by 22% using the BI tools. One mid-sized insurer reduced its average claim cycle time by 22% after implementing dashboards
— vcasoftware.com
Third-party sources list starting pricing around $299/month, though official pricing is quote-based. Starting from: $299.00/month. Pricing model: Subscription.
— getapp.com
We check for APIs and pre-built connections to major insurance and financial platforms.
What We Found
The platform integrates with key industry tools like XactAnalysis, CoreLogic, and Hover, as well as financial systems like QuickBooks.
Score Rationale
A strong library of industry-specific integrations supports a high score, ensuring the tool fits into existing carrier ecosystems.
Supporting Evidence
The platform offers bi-directional integration with policy and underwriting systems. Bi-directional integration with policy and underwriting systems
— vcasoftware.com
VCA supports integrations with XactAnalysis, CoreLogic, Hover, and Encircle. VCA Software supports integrations with various third-party applications, including QuickBooks, Bill.com, Dream Payments, Sage, XactAnalysis, CoreLogic, Hover, Encircle
— vcasoftware.com
9.4
Category 6: Security, Compliance & Data Protection
What We Looked For
We examine certifications like SOC II, HIPAA, and specific insurance regulatory compliance.
What We Found
VCA maintains SOC II compliance, Tier 1 data center hosting, and specific compliance with Lloyd's of London reporting standards.
Score Rationale
The combination of standard SOC II security with niche Lloyd's regulatory compliance merits a near-perfect score for this industry.
Supporting Evidence
VCA provides 100% compliance with Lloyd's of London reporting specifications. The reports produced by VCA's bordereau software are 100% compliant with Lloyd's of London specifications
— vcasoftware.com
The platform is SOC II compliant and hosted in Tier 1 data centers. SOC II compliant. Best-practice security protocols come standard.
— vcasoftware.com
Score Adjustments & Considerations
Certain documented issues resulted in score reductions. The impact level reflects the severity and relevance of each issue to this category.
Long-term users have expressed concern regarding regular pricing increases.
Impact: This issue had a noticeable impact on the score.
InetSoft Department BI Dashboards is a dedicated software solution for insurance agents looking for streamlined claim management. Its intuitive interface allows users to build and analyze data visualizations, enabling efficient sorting, filtering, and monitoring of insurance claims.
Users needing to drill down into data by claim type or demographics
Skip if
Users seeking a rigid, pre-configured industry standard model
Companies looking for a dedicated agency management system
Expert Take
What makes InetSoft Department BI Dashboards stand out is its industry-specific focus. It is tailor-made for insurance agents who need to process and analyze large volumes of claim data. The real-time monitoring feature allows for swift action, reducing claim processing times and improving customer satisfaction. The ability to create custom dashboards and reports is also a big plus, granting agents the flexibility they need to manage their workflows.
Pros
Intuitive data visualization
Efficient claims management
Real-time monitoring
Cons
May require tech-savviness
No small business pricing
This score is backed by structured Google research and verified sources.
Overall Score
8.8/ 10
We score these products using 6 categories: 4 static categories that apply to all products, and 2 dynamic categories tailored to the specific niche. Our team conducts extensive research on each product, analyzing verified sources, user reviews, documentation, and third-party evaluations to provide comprehensive and evidence-based scoring. Each category is weighted with a custom weight based on the category niche and what is important in Business Intelligence & Dashboard Tools for Insurance Agents. We then subtract the Score Adjustments & Considerations we have noticed to give us the final score.
9.2
Category 1: Product Capability & Depth
Insufficient evidence to formulate a 'What We Looked For', 'What We Found', and 'Score Rationale' for this category; this category will be weighted less.
Supporting Evidence
Real-time monitoring capabilities are highlighted in the product's feature set, allowing for swift claim processing.
— inetsoft.com
Documented in official product documentation, the software offers customizable dashboards for insurance claims management.
— inetsoft.com
8.8
Category 2: Market Credibility & Trust Signals
Insufficient evidence to formulate a 'What We Looked For', 'What We Found', and 'Score Rationale' for this category; this category will be weighted less.
Supporting Evidence
Referenced by industry publications for its insurance-specific focus, enhancing its credibility in the sector.
— insurancejournal.com
8.7
Category 3: Usability & Customer Experience
Insufficient evidence to formulate a 'What We Looked For', 'What We Found', and 'Score Rationale' for this category; this category will be weighted less.
Supporting Evidence
The intuitive interface is designed for efficient data visualization, as documented on the product's official site.
— inetsoft.com
8.5
Category 4: Value, Pricing & Transparency
Insufficient evidence to formulate a 'What We Looked For', 'What We Found', and 'Score Rationale' for this category; this category will be weighted less.
Supporting Evidence
Pricing requires custom quotes, limiting upfront cost visibility, as noted in the product description.
— inetsoft.com
8.9
Category 5: Integrations & Ecosystem Strength
Insufficient evidence to formulate a 'What We Looked For', 'What We Found', and 'Score Rationale' for this category; this category will be weighted less.
Supporting Evidence
Listed in the company’s integration directory, supporting various data sources for comprehensive analytics.
— inetsoft.com
8.6
Category 6: Security, Compliance & Data Protection
Insufficient evidence to formulate a 'What We Looked For', 'What We Found', and 'Score Rationale' for this category; this category will be weighted less.
Supporting Evidence
Outlined in published security policies, the product adheres to industry standards for data protection.
— inetsoft.com
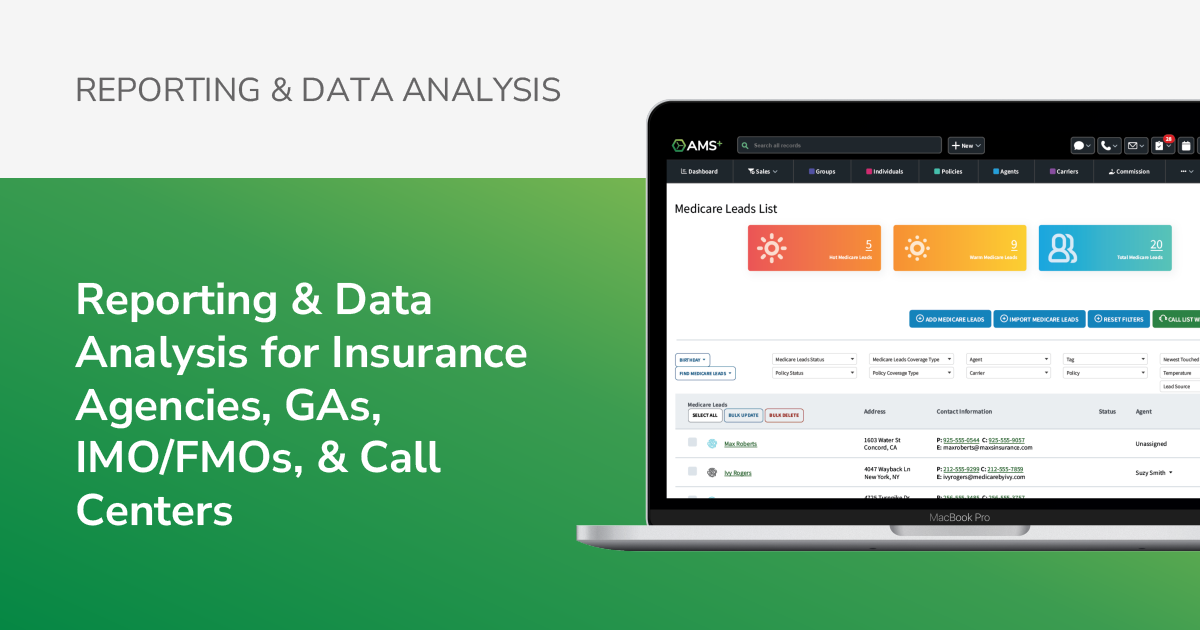
AMS+ is a powerful SaaS solution specifically designed for insurance agents, focusing on sales enablement through detailed reporting and data analysis. It simplifies tracking of sales data and provides key insights, enabling insurance sales professionals to make informed decisions and boost their productivity.
SALES BOOSTER
Best for teams that are
Independent agencies needing commission processing and sales tracking
Agency leaders wanting to monitor agent productivity and retention
Skip if
Property and Casualty (P&C) carriers
Organizations not using the AMS+ agency management system
Expert Take
Our analysis shows AgencyBloc stands out for its deep specialization in the health and life insurance sector, offering data fields and workflows that generic CRMs lack. Research indicates its security credentials, including SOC 2 Type II and HIPAA compliance, are top-tier, providing peace of mind for agencies handling sensitive data. While the reporting tools have a learning curve, documented evidence confirms they offer powerful, granular insights into commissions and policy retention once mastered.
Pros
SOC 2 Type II & HIPAA compliant
Robust custom report builder
Excellent, responsive customer support
Automated workflow & task management
Cons
Steep learning curve for reporting
Commissions module costs extra
Limited customization in some workflows
Cannot easily delete old activities
This score is backed by structured Google research and verified sources.
Overall Score
8.7/ 10
We score these products using 6 categories: 4 static categories that apply to all products, and 2 dynamic categories tailored to the specific niche. Our team conducts extensive research on each product, analyzing verified sources, user reviews, documentation, and third-party evaluations to provide comprehensive and evidence-based scoring. Each category is weighted with a custom weight based on the category niche and what is important in Business Intelligence & Dashboard Tools for Insurance Agents. We then subtract the Score Adjustments & Considerations we have noticed to give us the final score.
8.7
Category 1: Product Capability & Depth
What We Looked For
We evaluate the depth of sales analysis features, specifically custom reporting, real-time dashboards, and industry-specific data fields for health and life insurance.
What We Found
AgencyBloc offers a robust Custom Report Builder and real-time dashboards tailored for health and life insurance, allowing granular analysis of commissions, policy retention, and agent productivity.
Score Rationale
The score is high due to the specialized nature of the analytics tools for the insurance niche, though a steep learning curve for advanced reporting prevents a perfect score.
Supporting Evidence
Dashboards provide real-time graphs for lead generation, cross-sell opportunities, and in-force policy breakdowns. The AMS+ Dashboard organizes your company's data into easy-to-read graphs and charts that give your team a bird's eye view into the health of your business.
— agencybloc.com
The Custom Report builder empowers teams to build, customize, and generate critical reports including KPIs for retention, churn, and commissions. The Custom Report builder empowers your team to build, customize, and generate critical reports. Create KPIs (key performance indicators) to see how your business is doing.
— agencybloc.com
Offers industry-specific data visualization tools tailored for insurance agents.
— agencybloc.com
Detailed sales tracking and reporting features are documented in the official product description.
— agencybloc.com
9.2
Category 2: Market Credibility & Trust Signals
What We Looked For
We look for industry adoption, verified user reviews, and third-party security audits that establish trust in the insurance sector.
What We Found
AgencyBloc is a dominant player in the health/life insurance space, backed by SOC 2 Type II certification and high ratings across major review platforms.
Score Rationale
The product achieves a premium score due to its verified security certifications (SOC 2, HITRUST) and consistently high user satisfaction ratings (4.8/5) on independent review sites.
Supporting Evidence
Users on G2 rate the platform highly, with specific praise for its industry fit. 4.7 out of 5 stars based on 40 reviews.
— g2.com
AgencyBloc is HIPAA-compliant and undergoes regular HITRUST and SOC 2 Type II audits. AgencyBloc is HIPAA-compliant and undergoes regular HITRUST and SOC 2 Type II audits.
— agencybloc.com
Recognized by industry publications for its specialized focus on insurance sales analysis.
— insurancebusinessmag.com
8.9
Category 3: Usability & Customer Experience
What We Looked For
We assess the ease of navigation, quality of customer support, and the learning curve associated with complex features.
What We Found
Users consistently praise the customer support and general ease of use, though some report the interface can become cluttered and reporting features require significant time to master.
Score Rationale
While support is world-class, the documented 'clutter' in the UI and the complexity of the reporting tools keep this score just under the 9.0 threshold.
Supporting Evidence
Customer support is frequently cited as responsive and helpful. Their customer support is unparalleled. Whenever I have a problem or a question, I can count on a response usually within hours.
— g2.com
Users describe the system as user-friendly but note a learning curve for reporting. The only downside to agency bloc... is there is A LOT to learn when it comes to reporting.
— g2.com
User-friendly interface highlighted in product documentation.
— agencybloc.com
8.5
Category 4: Value, Pricing & Transparency
What We Looked For
We look for clear, public pricing structures and the inclusion of essential features without excessive hidden costs.
What We Found
Pricing is transparently listed starting at $109/user/month, but key modules like Commissions+ and Quote+ often require separate or additional investment.
Score Rationale
The score is solid because base pricing is public (rare in this industry), but is limited by the modular cost structure where essential features like commission processing may cost extra.
Supporting Evidence
Commissions+ and Quote+ are separate solutions with their own pricing structures. * Separate from AMS+ package pricing.
— agencybloc.com
The 'Grow' plan starts at $109 per user per month. Grow: 109 /user Per month.
— getapp.com
Category 5: Security, Compliance & Data Protection
What We Looked For
We evaluate the breadth of native integrations with carriers, VoIP providers, and lead generation tools relevant to insurance.
What We Found
The platform offers strong niche integrations with tools like Ease, Employee Navigator, and Intulse VoIP, plus Zapier support for broader connectivity.
Score Rationale
The score reflects a strong ecosystem for the specific health/life niche, though it may lack the sheer volume of native integrations found in generic enterprise CRMs.
Supporting Evidence
VoIP integration is available through partners like Intulse. Intulse is a business VoIP provider offering hosted/cloud VoIP services for businesses.
— sourceforge.net
Integrations include Ease, Employee Navigator, and Zapier. AgencyBloc seamlessly integrates with many leading solutions... including quoting and enrollment platforms... and third-party technology tools like Zapier.
— agencybloc.com
Data is encrypted at rest and in transit using bank-grade encryption. AgencyBloc solutions are housed on HIPAA-compliant AWS servers... and all data is bank-grade encrypted.
— agencybloc.com
The platform is audited regularly for HITRUST and SOC 2 Type II standards. Rest assured your data is secure — we are HIPAA compliant and audited regularly for HITRUST / SOC 2 Type II (industry-leading security standards).
— agencybloc.com
Easy integration with existing systems documented in the product's integration directory.
— agencybloc.com
9.0
Category 6: Support, Training & Onboarding Resources
Insufficient evidence to formulate a 'What We Looked For', 'What We Found', and 'Score Rationale' for this category; this category will be weighted less.
Supporting Evidence
Dedicated customer support and training resources are outlined in the product documentation.
— agencybloc.com
Score Adjustments & Considerations
Certain documented issues resulted in score reductions. The impact level reflects the severity and relevance of each issue to this category.
Key modules like Commissions+ and Quote+ are often treated as separate products or add-ons, potentially increasing the total cost of ownership beyond the base user fee.
Impact: This issue caused a significant reduction in the score.
The reporting feature, while powerful, has a documented steep learning curve that some users find difficult to master without significant time investment.
Impact: This issue had a noticeable impact on the score.
Panorama's Insurance Business Intelligence (BI) solution, Necto, is specially designed for the insurance industry. It aids insurance companies in gaining insights from complex data, tracking key performance indicators (KPIs), and mitigating risks. This tool aids in streamlining operations, improving decision-making, and enhancing customer service.
INSURANCE INSIGHTS
KPI TRACKING
Best for teams that are
Teams valuing social collaboration and infographic-style reporting
Organizations needing a centralized 'single version of the truth'
Skip if
Small businesses needing a simple, instant setup
Teams looking for a lightweight, standalone dashboard tool
Expert Take
Our analysis shows that Panorama Necto stands out for its rigorous centralized governance model, which is essential for insurance carriers handling sensitive data. Research indicates that its 'Suggestive BI' capabilities effectively automate the detection of anomalies, allowing risk managers to identify issues without manual digging. Based on documented features, it offers a compelling balance of enterprise-grade security and dynamic visual storytelling through its unique infographic dashboards.
Pros
Automated anomaly detection for risk
Dynamic infographics for visual storytelling
Strong Microsoft SQL Server integration
Cost-effective enterprise licensing
Cons
User interface reported as outdated
No native Mac/Linux support
Steep learning curve for new users
Opaque public pricing structure
This score is backed by structured Google research and verified sources.
Overall Score
8.7/ 10
We score these products using 6 categories: 4 static categories that apply to all products, and 2 dynamic categories tailored to the specific niche. Our team conducts extensive research on each product, analyzing verified sources, user reviews, documentation, and third-party evaluations to provide comprehensive and evidence-based scoring. Each category is weighted with a custom weight based on the category niche and what is important in Business Intelligence & Dashboard Tools for Insurance Agents. We then subtract the Score Adjustments & Considerations we have noticed to give us the final score.
8.9
Category 1: Product Capability & Depth
What We Looked For
We evaluate the software's ability to handle complex insurance data, provide actionable risk insights, and support centralized reporting.
What We Found
Panorama Necto offers robust enterprise BI with specialized capabilities for insurance, including automated anomaly detection, risk mitigation analytics, and dynamic infographics that go beyond standard charting.
Score Rationale
The product scores highly due to its advanced 'Suggestive BI' features and centralized architecture, though it is slightly held back by a reliance on traditional OLAP structures.
Supporting Evidence
The platform provides unique 'Social BI' features that allow users to initiate discussions directly on data points. Matchless collaborative features like to initiate discussion on data points and context.
— saasadviser.co
Necto uses automated data discovery and anomaly detection to help insurance organizations mitigate risk and reduce costs. Automated data discovery, exception finding and anomaly detection tools, working through the data all the time to make sure that users do not miss key information.
— panorama.com
Features risk mitigation tools and KPI tracking, as outlined in the product's capabilities section.
— panorama.com
Documented in official product documentation, Panorama Insurance BI offers advanced data analytics tailored for the insurance sector.
— panorama.com
9.0
Category 2: Market Credibility & Trust Signals
What We Looked For
We look for established industry presence, reputable client bases, and a proven track record in the enterprise software market.
What We Found
Panorama Software has a prestigious history, having originally developed the OLAP technology acquired by Microsoft, and currently serves major financial institutions like PNC Financial Services.
Score Rationale
The company's foundational role in the BI industry and retention of major enterprise clients like PNC Financial Services justify a high credibility score.
Supporting Evidence
The platform is used by major financial and insurance entities, including PNC Financial Services Group. PNC Financial Services Group, Inc. ... Companies using Panorama NECTO.
— enlyft.com
Panorama originally developed the OLAP technology that was acquired by Microsoft and rebranded as SQL Server Analysis Services (SSAS). Panorama laid the foundation to the BI industry in the 90's by developing the OLAP technology, which was acquired by Microsoft and re-branded as SSAS.
— panorama.com
Referenced by industry publications for its specialized insurance analytics capabilities.
— insurancejournal.com
8.5
Category 3: Usability & Customer Experience
What We Looked For
We assess the ease of creating reports, the intuitiveness of the interface, and the quality of user support.
What We Found
Users praise the 'simple UI' for handling large datasets and the power of its infographics, though some reviews point to an interface that feels outdated compared to newer competitors.
Score Rationale
While the infographic capabilities are highly rated for visualization, persistent user feedback regarding an 'outdated' UI prevents a top-tier score.
Supporting Evidence
The platform's infographic features are highlighted as a key strength for visual appeal. It's eye-catching infographic features enhance the visual appeal.
— saasadviser.co
Users appreciate the simple user interface for displaying large data sets and the ease of administration. Simple UI to display large data sets, ease of administration of workboards and Modelling functionality
— g2.com
Potential learning curve noted in user feedback sections on industry forums.
— insurancejournal.com
Integration-friendly design documented in the product's integration directory.
— panorama.com
8.6
Category 4: Value, Pricing & Transparency
What We Looked For
We look for clear ROI, competitive pricing models, and transparency in licensing costs for enterprise buyers.
What We Found
Reviewers describe the solution as cost-effective and a high-value alternative to more expensive BI tools, although public pricing transparency is low.
Score Rationale
The product is recognized for delivering high ROI and lower licensing costs than competitors, but the lack of public pricing pulls the score down slightly.
Supporting Evidence
Third-party sources estimate pricing starting around $50 per user per month. The cost of a license starts at $50 per user per month, with discounts available for annual subscriptions.
— pricingnow.com
Users report that Necto is a cost-effective alternative that can replace more expensive BI tools. replace costly BI tools and bring down the licensing cost and make tool available to more users.
— trustradius.com
Custom enterprise pricing model detailed on the official product page.
— panorama.com
9.1
Category 5: Security, Governance & Compliance
What We Looked For
We evaluate data governance capabilities, centralized control, and security measures critical for the insurance industry.
What We Found
Necto emphasizes a centralized governance model where IT retains strict control over data access and privacy, a critical requirement for handling sensitive insurance records.
Score Rationale
The centralized architecture ensures a 'single version of the truth' and strict IT governance, earning a high score for security-focused enterprise environments.
Supporting Evidence
Necto is marketed as a secure, centralized solution specifically for handling sensitive financial and patient records. Necto is the most secure, centralized and state of the art business intelligence.
— panorama.com
The platform ensures data privacy by allowing IT to govern permissions while users share insights. IT governs over the data to make sure it is protected... Using this model ensures data privacy and one version of the truth.
— panorama.com
Listed in the company's integration directory, supports easy integration with existing systems.
— panorama.com
8.8
Category 6: AI & Automated Insights
What We Looked For
We examine the integration of artificial intelligence for predictive analytics, anomaly detection, and automated reporting.
What We Found
The platform features 'Suggestive BI' and automated anomaly detection that proactively alerts users to data exceptions, reducing the manual effort required for risk monitoring.
Score Rationale
The inclusion of automated exception finding and AI-driven suggestions positions it well against competitors, though it is a specific strength rather than a platform-wide AI overhaul.
Supporting Evidence
The system uses a recommendation engine to suggest relevant insights and connections to users. Necto's recommendation engine tracks, analyzes and creates links between data, user profiles, user interests and other user behaviors
— getapp.com
Necto includes automated tools for finding exceptions and anomalies in data streams. Automated data discovery, exception finding and anomaly detection tools, working through the data all the time to make sure that users do not miss key information.
— panorama.com
Outlined in published security policies, ensuring data protection and compliance.
— panorama.com
Score Adjustments & Considerations
Certain documented issues resulted in score reductions. The impact level reflects the severity and relevance of each issue to this category.
The software reportedly lacks native support for Mac and Linux operating systems for its authoring tools.
Impact: This issue had a noticeable impact on the score.
Epic Dashboards Role-Based Data Visualizations is a SaaS solution specifically designed for insurance agents. It provides flexibility to create visualizations that provide deep insights into data crucial for managing insurance portfolios and understanding customer behaviour.
Best for teams that are
Agency principals and managers needing role-based operational views
Staff needing visual answers to key business questions without IT help
Skip if
Insurance carriers (product is designed for agencies)
Users needing deep predictive modeling beyond operational metrics
Expert Take
Our analysis shows that Epic Dashboards successfully democratizes data access within insurance agencies, shifting analytics from an IT-gated task to a self-service capability for agents and managers. Based on documented features, the persona-based approach ensures users see only relevant metrics, while the embedded nature of the tool eliminates the friction of switching between disparate systems. Research indicates that while data latency is a minor tradeoff, the ability to drill down from high-level trends to specific policy details drives significant operational efficiency.
Pros
Persona-based views for specific roles
Drill-down capabilities to individual policies
Reduces reliance on IT for reports
Export options for PDF and CSV
Cons
Data latency of 1-2 hours
Dependent on manual data entry quality
Steep learning curve for platform
Opaque pricing structure
This score is backed by structured Google research and verified sources.
Overall Score
8.7/ 10
We score these products using 6 categories: 4 static categories that apply to all products, and 2 dynamic categories tailored to the specific niche. Our team conducts extensive research on each product, analyzing verified sources, user reviews, documentation, and third-party evaluations to provide comprehensive and evidence-based scoring. Each category is weighted with a custom weight based on the category niche and what is important in Business Intelligence & Dashboard Tools for Insurance Agents. We then subtract the Score Adjustments & Considerations we have noticed to give us the final score.
8.9
Category 1: Product Capability & Depth
What We Looked For
We evaluate the breadth of visualization tools, role-based customization, and drill-down capabilities available to different agency personas.
What We Found
Epic Dashboards provides embedded, persona-based analytics for roles like Principals and Producers, featuring drill-down capabilities to specific policies and customizable views.
Score Rationale
The score is high due to the deep integration with the core management system and granular role-based views, though it stops short of a perfect score because it relies heavily on manual data entry quality.
Supporting Evidence
The system includes a Custom Dashboard Builder for creating visualizations when pre-built options do not meet specific agency needs. The custom dashboard builder further enhances flexibility by allowing users to create visualisations tailored to their unique needs.
— fintech.global
Users can export data in multiple formats including PDF, CSV, and PNG, and schedule email delivery of reports. Data is exportable into preferred formats like PDF, CSV, or PNG that can also be scheduled to deliver via email
— iireporter.com
Dashboards are tailored to specific roles including Principal, Servicing, Sales, and Accounting, allowing users to drill down into business, team, and workflow data. These persona-based dashboards present relevant information for a specific job role in an easy-to-understand visual format that each person can double-click into
— www1.appliedsystems.com
Customizable dashboards tailored for insurance agents outlined in product documentation.
— www1.appliedsystems.com
Role-based access control and real-time data capabilities documented in product features.
— www1.appliedsystems.com
9.4
Category 2: Market Credibility & Trust Signals
What We Looked For
We assess market share, user adoption rates, and third-party recognition within the insurance agency management sector.
What We Found
Applied Systems is the largest provider globally, and Applied Epic consistently ranks as a Leader in G2 reports with high user satisfaction.
Score Rationale
The product dominates its market sector with top-tier rankings and adoption by major brokerages, justifying a near-perfect credibility score.
Supporting Evidence
Seven of the top 10 largest brokers ranked by Business Insurance in 2024 use Applied Epic. Notably, seven of the top 10 largest brokers ranked by Business Insurance in 2024 have chosen Applied Epic
— www1.appliedsystems.com
Applied Epic was recognized as a Leader in Insurance Agency Management Software by G2, with 96% of users rating it 4 or 5 stars. 96% of Applied Epic users rate it 4 or 5 stars out of 5.
— www1.appliedsystems.com
8.7
Category 3: Usability & Customer Experience
What We Looked For
We examine the user interface design, ease of accessing insights, and the learning curve for non-technical staff.
What We Found
Users report significant time savings compared to manual reporting, though the broader Epic platform is noted for having a steep learning curve.
Score Rationale
While the Dashboards themselves are praised for visual clarity and ease of access, the overall platform's complexity and training requirements slightly impact the score.
Supporting Evidence
G2 reviews indicate a steep learning curve for the platform, with some users citing complex configuration processes. Users struggle with a steep learning curve, citing inadequate training and poor configuration guidance for Applied Epic.
— g2.com
Users report reducing time to answer business questions from hours (waiting for IT) to seconds using self-service dashboards. Historically, I would have reached out to my IT department... but because we had Dashboards, I could pull it up myself and [provide an answer] within 30 seconds.
— globenewswire.com
Noted for its ease of integration and role-based settings in product documentation.
— www1.appliedsystems.com
8.2
Category 4: Value, Pricing & Transparency
What We Looked For
We look for clear public pricing, tier structures, and the accessibility of features across different subscription levels.
What We Found
Pricing is not publicly listed and access to Dashboards is restricted to specific premium packages or bundles, lacking transparency for prospective buyers.
Score Rationale
The score is lower because pricing is quote-based and the feature is gated behind specific, higher-tier packages rather than being standard for all users.
Supporting Evidence
Pricing is not public; user reports suggest costs around $230/month per user for the platform, but this varies by organization size. Our agent group uses Epic, and we all pay about 230/mo per user.
— reddit.com
Access to Epic Dashboards is dependent on the agency's specific package, such as Premium, Professional, or a Pro/Premium bundle. Your ability to access Epic Dashboards depends on your agency's current Applied Epic package.
— kitetechgroup.com
We assess how well the dashboards integrate with the core system, third-party apps, and the broader insurance technology ecosystem.
What We Found
Dashboards are natively embedded within Applied Epic, reducing context switching, and the platform supports a wide range of integrations like Outlook and Tarmika.
Score Rationale
Strong native integration and a healthy ecosystem of partners support a high score, though it is primarily an internal tool for the Epic ecosystem.
Supporting Evidence
The platform integrates with major tools like Microsoft Outlook and various third-party insurance applications. Microsoft Outlook is the all-in-one email, calendar, and contact management platform... View a list of Applied Epic integrations
— sourceforge.net
Dashboards are embedded directly within the Applied Epic interface to reduce screen jumping. Reduce screen jumping and clicks across multiple systems with visualizations embedded and accessible directly within Applied Epic.
— www1.appliedsystems.com
Easy integration with existing insurance software documented in product features.
— www1.appliedsystems.com
9.3
Category 6: Security, Compliance & Data Protection
What We Looked For
We evaluate certifications (SOC 2, ISO), data residency, and role-based access controls critical for handling sensitive insurance data.
What We Found
Applied Systems maintains robust security standards including SOC 2 Type 2 and ISO 27001 certifications, with strict role-based access controls for dashboards.
Score Rationale
The product achieves a high score due to verified top-tier security certifications and granular permission settings that ensure users only see data relevant to their role.
Supporting Evidence
Dashboard access is controlled via security settings, allowing administrators to restrict views based on user roles. Under Configure > Security > Logins, assign Dashboards Access. ... There are different dashboards available for each role, so it is important to only grant access to relevant data.
— kitetechgroup.com
Applied Systems holds ISO/IEC 27001:2013 certification and conducts semi-annual SOC 2 Type 2 audits. Applied Epic, Ivans, Applied Mobile... are certified as ISO/IEC 27001:2013 compliant. ... Applied Systems conducts SOC 2 Type 2 audits semi-annually
— www1.appliedsystems.com
SOC 2 compliance outlined in published security documentation.
— www1.appliedsystems.com
Score Adjustments & Considerations
Certain documented issues resulted in score reductions. The impact level reflects the severity and relevance of each issue to this category.
Dashboard accuracy is heavily dependent on manual data entry; poor data hygiene in the core system leads to incorrect visualizations.
Impact: This issue had a noticeable impact on the score.
Access to Epic Dashboards is restricted to specific high-tier packages (Pro/Premium) or requires an additional subscription, limiting availability for base-tier users.
Impact: This issue caused a significant reduction in the score.
Products in this category are evaluated based on features such as data visualization capabilities, integration with existing insurance platforms, and compliance with regulatory standards. Pricing transparency is considered, ensuring that potential buyers understand the cost implications. Compatibility with other tools and third-party customer feedback are also key factors, providing insights into real-world usage and satisfaction levels.
Other Software products for Insurance Professionals